BSE MAINFRA – Unfolding Impulse Wave 5
Timeframe: 4h
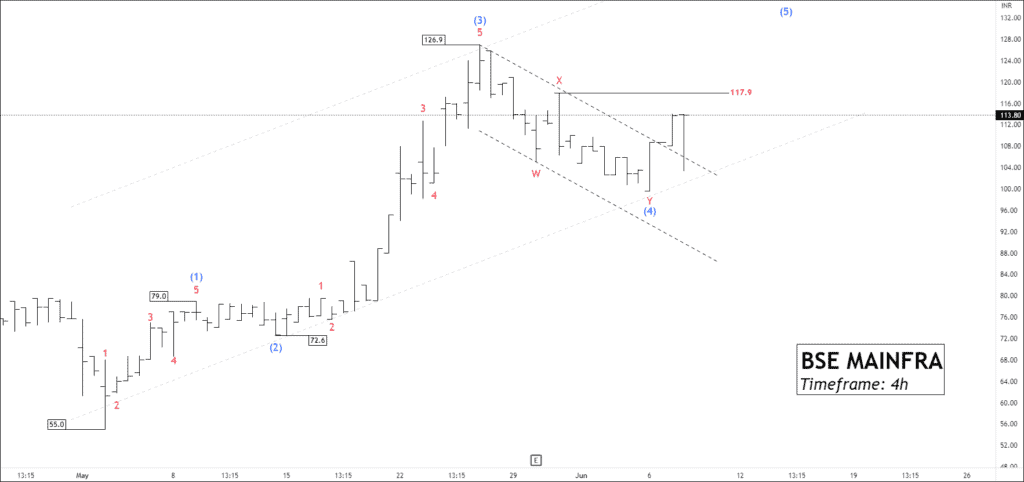
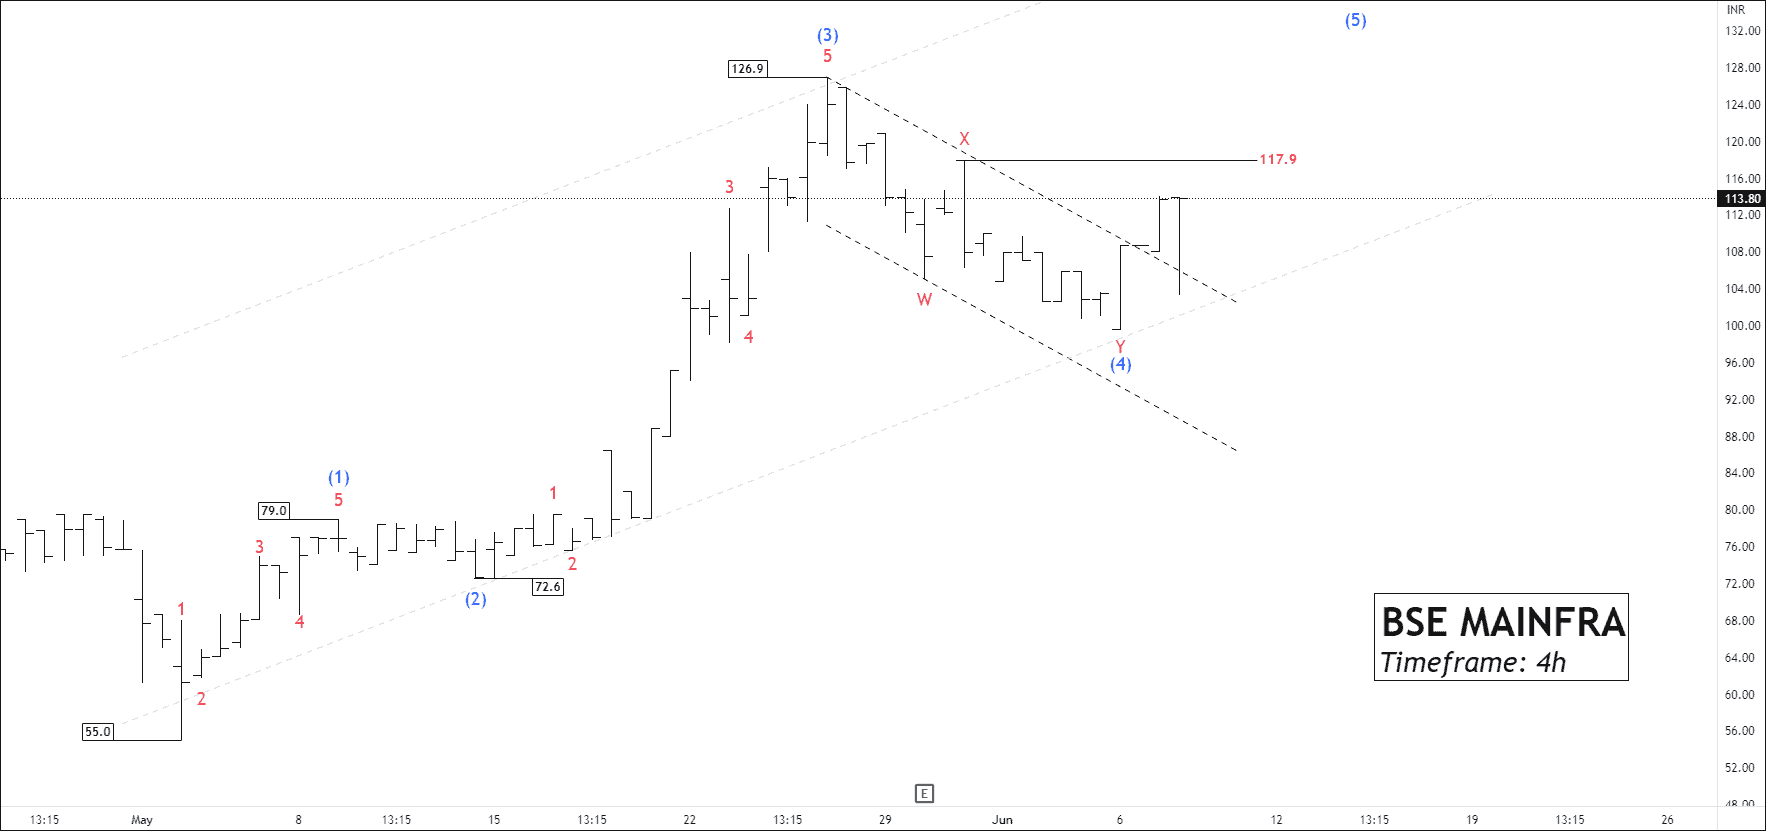
BSE MAINFRA stock has initiated a new upward movement, commencing an impulse cycle after reaching a low of 55. The stock’s impulsive wave (3) has successfully reached a peak at 126.9. Following this, wave 4 unfolded in the form of a double three pattern and concluded at 99.5.
A corrective channel has been formed by connecting the ending point of wave three with point X, and then connecting it with wave (W). According to Elliott Wave principles, the price can only change its trend once wave X is breached.
Currently, the price is trading above the 200-day, 100-day, and 50-day Exponential Moving Averages (EMA), indicating positive market sentiment. However, the recent high appears vulnerable and could be surpassed by bullish investors. If the price breaks out above wave X at 117.9, traders may consider buying the stock with the following target levels: 126.9 – 139.2 – 148.3.
NSE POWERGRID – Wammies Formation
On the daily timeframe chart, NSE POWERGRID is displaying a robust outlook. The stock has recently surpassed a critical resistance level at 238, indicating a bullish momentum. The price pattern resembles a Wammie formation, with the neckline set at 238. The stock is trading above the exponential moving average (EMA) bands of 20, 50, 100, and 200. This reinforces the notion of an upcoming upward movement in the price.
If the price manages to sustain its position above 238, traders can consider buying the stock with the following target levels: 241 – 246 – 257+.
Get free important share market ideas on stocks & nifty tips chart setups, analysis for the upcoming session, and more by joining the below link: Stock Tips
Have you any questions/feedback about this article? Please leave your queries in the comment box for answers.