Timeframe: Daily
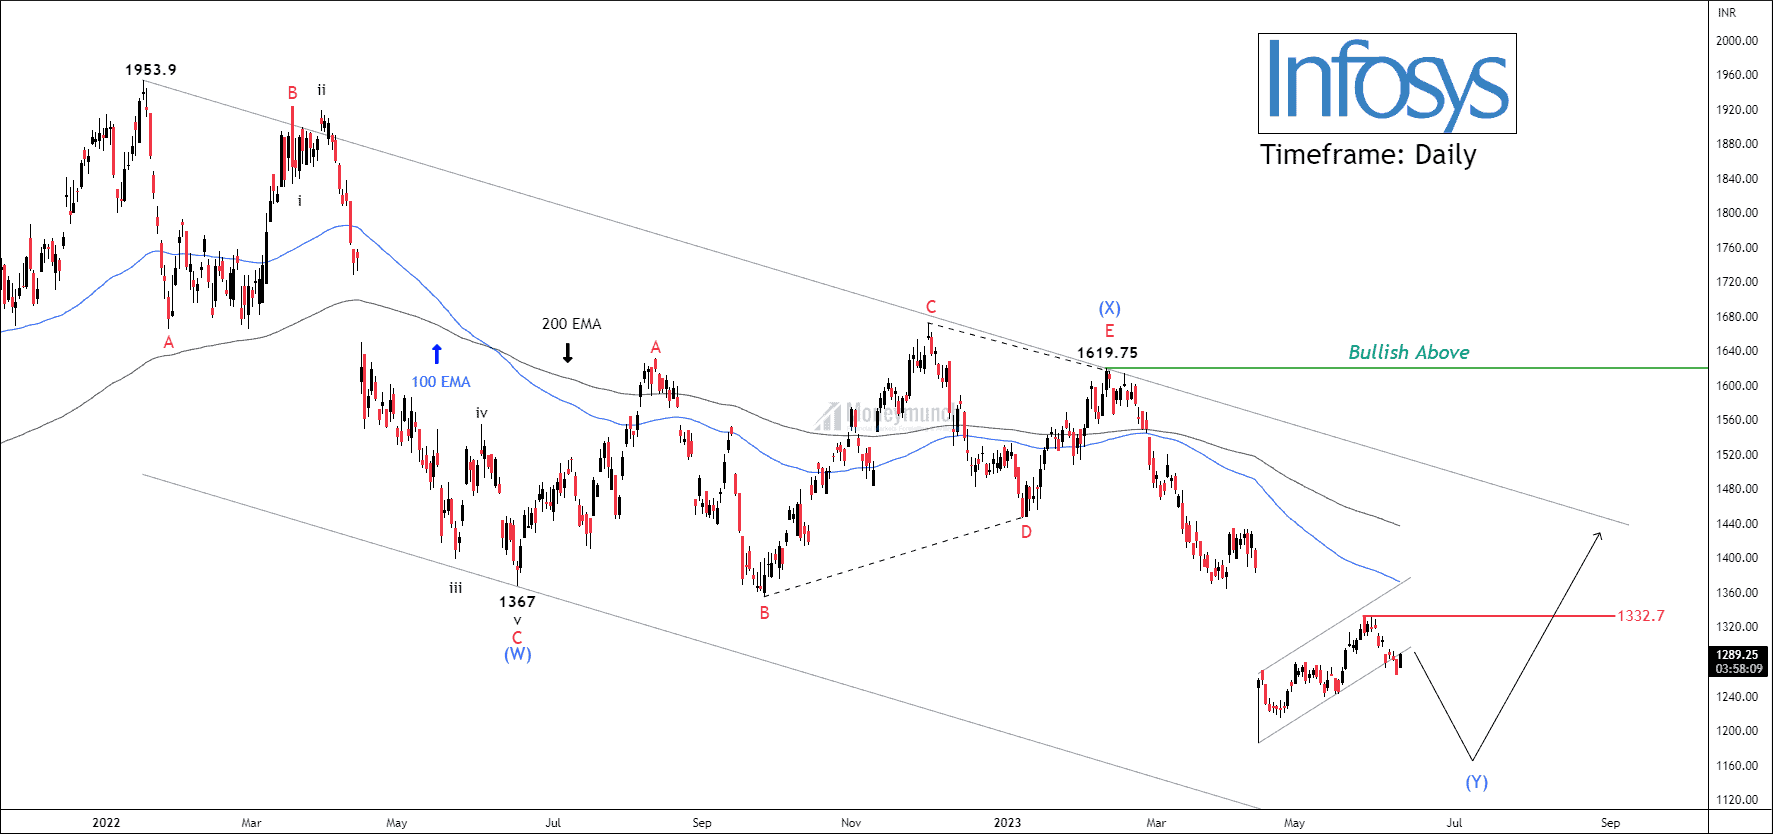
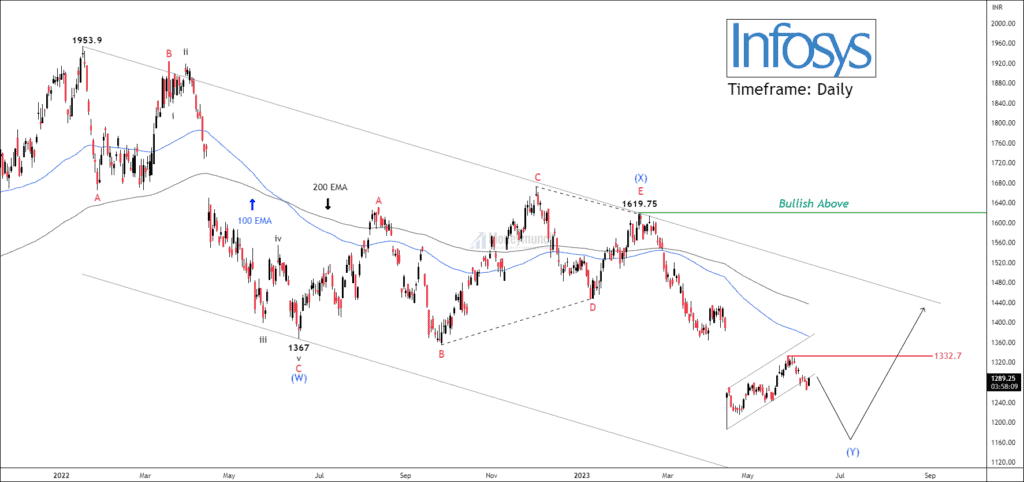
NSE INFOSYS has been experiencing a prolonged corrective phase lasting over 73 weeks, with its movement consistently below the 50/100/200 EMA. This indicates a bearish sentiment for the security. On the daily timeframe chart, price action has formed double three patterns.
As per wave analysis, INFOSYS completed wave (w) at 1367, followed by a triangular wave X at 1619.7. Currently, the price is in the process of forming the final wave (Y). A corrective channel has been established for wave B, and a breakdown of this channel can serve as an entry signal for traders. The potential targets for this trade are 1246 – 1219 – 1179+.
Once wave (Y) is completed, traders can monitor the breakout of wave 1332.7 as a potential entry point for targeting the next wave (X). It is important to note that the breakout of wave (X) will signal the beginning of a new cycle.
Get free important share market ideas on stocks & nifty tips chart setups, analysis for the upcoming session, and more by joining the below link: Stock Tips
Have you any questions/feedback about this article? Please leave your queries in the comment box for answers.

 Lock
Lock