AUDJPY Is Forming A Contracting Triangle

Free Forex AUDJPY Tips

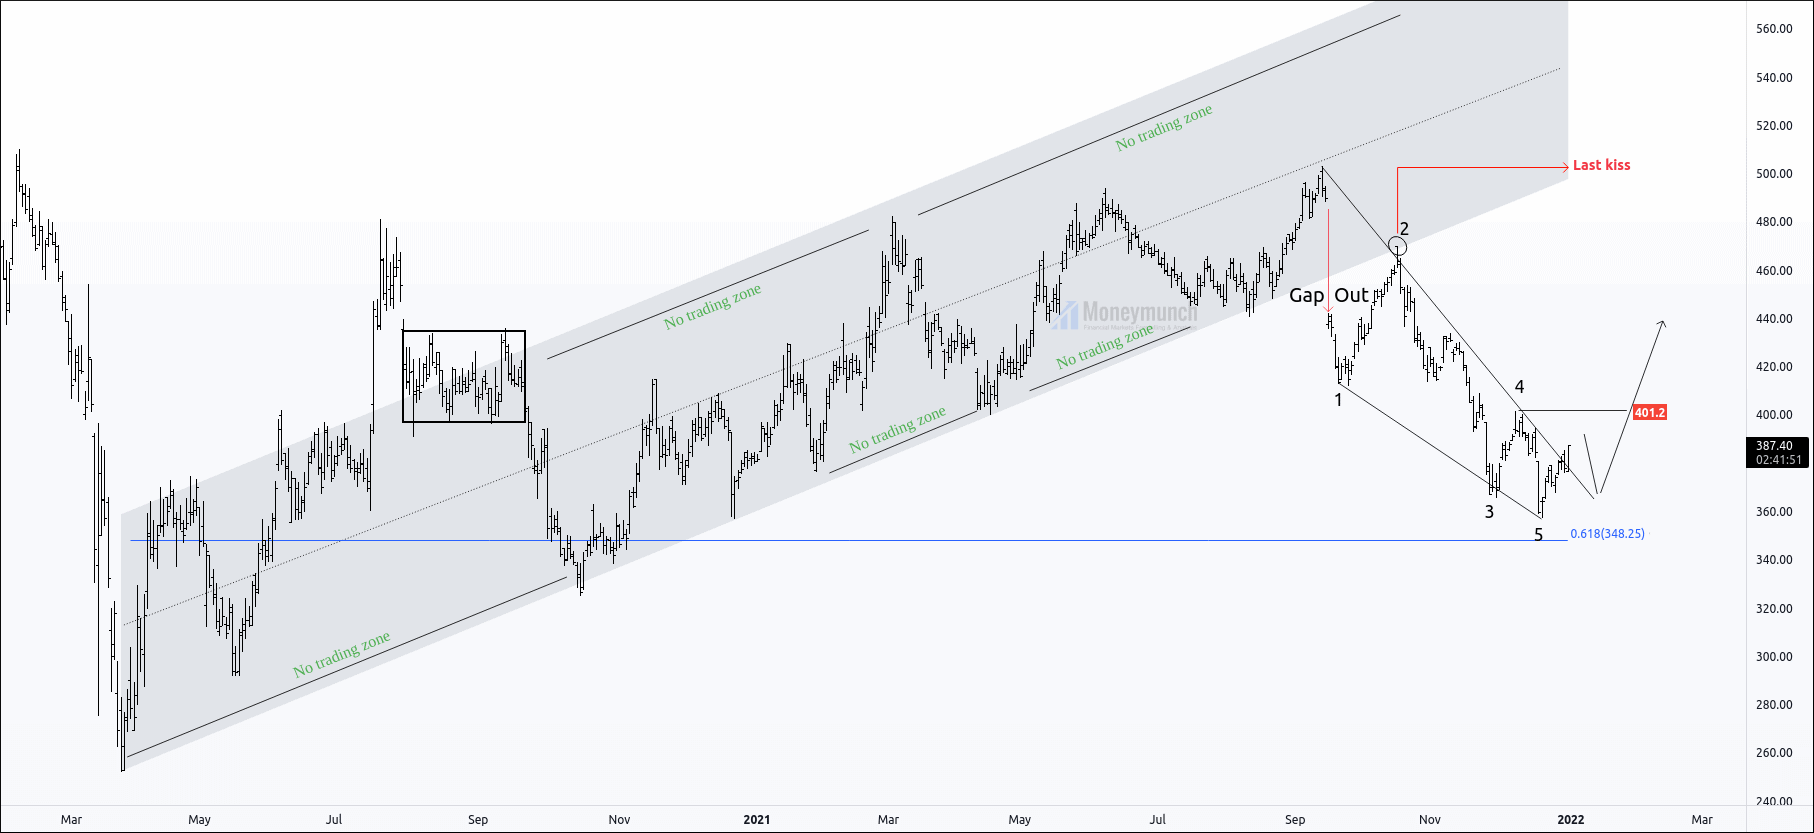
Currently, AUDJPY is forming a contracting triangle on the corrective wave ((4)). Price has completed sub-wave (C), and sub-wave (D) is in progress.

After completion of the (D) wave, the terminating wave sub-wave (E) will break the BD trendline of the contracting triangle.

Wave (D) can end nearby 78.6% retracement of wave (B).
If the price breaks the BD trendline, It can move to 85.35 – 86.25 – 88 – 89. The traders should put protective stop loss at 78.78.
wave (5) may end at 89.609, which is inverse Fibonacci retracement 1.618% of wave (4)

Wave (E) can complete between 0.618 to .786 Fibonacci levels.
That’s why a trader can expect the following targets for wave (E) 83.44 – 82.50 – 81.03 as targets of wave E. If you want to trade wave (E), then you should have a trailing stop due to the high volatility of wave (E).

Continue reading

Trader’s Roadmap Jan, 2022 – What I expect on Indian Market?

The upcoming market moves will destroy 80% of traders’ investments. We are sharing with you NSE’s perspective that will be helpful in January 2022.

free nse nifty 1h chart tips

NIFTY: Bullish Triple Zigzag (1H)

The spot nifty hourly chart at an exciting juncture. The juncture isn’t easy to identify the next turn for beginners. Where will upturn sustain?

Below levels are very crucial. That will help you make a new position or create a trade setup on Nifty.

The first observation should be on the trend. And it is down by looking at the above chart (left to right). The price is defining a lower low. And that is W, Y, and Z. Moreover, the low high is similar (1X and 2X). Hence, I have chosen Oct 18605 high and Dec 16410 low. Wherein come out Bullish Triple Zigzag corrective pattern formation.

Are you expecting a continuous downtrend? Then look at the equality ratio. That gives you resistance levels. And after the ending of the point of the Z wave, ((w))=((y)) at 17574.

Furthermore, the level of 17600 is equal to waves A and C, but the 17503 level is the first upcoming resistance A = C | 0.789 ratio.

Trend Reversal Key Level:
Reconsider the wave count at 17640 lower high.

According to the current market situation, the Nifty price is under 17640. It’s a direct sign of downtrend moves. And the first target will be the 17077 level.

Nifty traders must look at this DJIA chart.

Can you see the new high on DJIA? Further information I will update you soon.To become a subscriber, subscribe to our free newsletter services. Our service is free for all.

Continue reading

Nifty Outlook: Bull Trend Or Bull Trap?

free nse nifty stock tips

In my previous post, I have mentioned that nifty can make an upward move before making the last leg. Nifty was at 16999, and it has made a high of 17400 on 31st December 2021.

Click here to read previous article.

Nifty is out of the channel and near to the previous lower high.

If nifty breaks up of 17639, we can expect a big upward move to 18210, which indicates that the correction is complete.

And if it fails to break the parallel channel, we can expect the following targets: 16909-16690-16449-16369, and the price will start wave C of wave (Z).

Please note that the downtrend is below 17639.

I will upload further information soon. To become a subscriber, subscribe to our free newsletter services. Our service is free for all.

Continue reading

EWT: CADJPY Preparing for 93.84

free forex cadjpy currency calls

Price has completed the C leg of corrective wave Primary ((4)), and the price will march for impulsive wave ((5)).

Wave Formations:

Wave ((1))

– Leading diagonal
– Formed on extreme low
– Termination sub-wave 5 is smaller than 3

Wave ((2))

– Zigzag
50% of wave ((1))
– Ended near the sub-wave 4 of an impulsive wave.

Wave ((3))

– Impulse (Five wave moves)
– Extended 2.618% of wave 1

Wave ((4))

– Running triangle/running flat
38.2% of wave ((3))
– Ended above wave (b)

Wave ((5))

– Wave ((1)) was a leading diagonal, so wave ((5)) can’t form as a diagonal. It will be an impulsive wave.
– Wave 3 can end near 161.8% of the 4th wave at 93.492.
– Wave 1= Wave 5 at 93.765
– Wave 5 can complete after touching the parallel channel at 93.849.

We can expect the following targets: 91.46-92.29-93.849

Continue reading

Will BPCL change the trend by breaking the falling wedge?

free nse bpcl stock calls

BPCL had broken the uptrend channel and started correcting the previous move.

It has made a falling wedge, which is on the level of 61.8%.

Price will reach 401 and may face minor resistance. But If the price gives a strong close above 401.2, we can see the following targets: 415-439-456-469 and more.

If the price doesn’t make a higher low and breaks 357, it will make a down move of about 340.

Traders can wait for a pullback, and they can enter after the breakout of 401.2.

To become a subscriber, subscribe to our free newsletter services. Our service is free for all.

Continue reading