2020’s Uptrend Channel Is Everything For MCX Nickel

free commodity mcx nickel daily chart tips

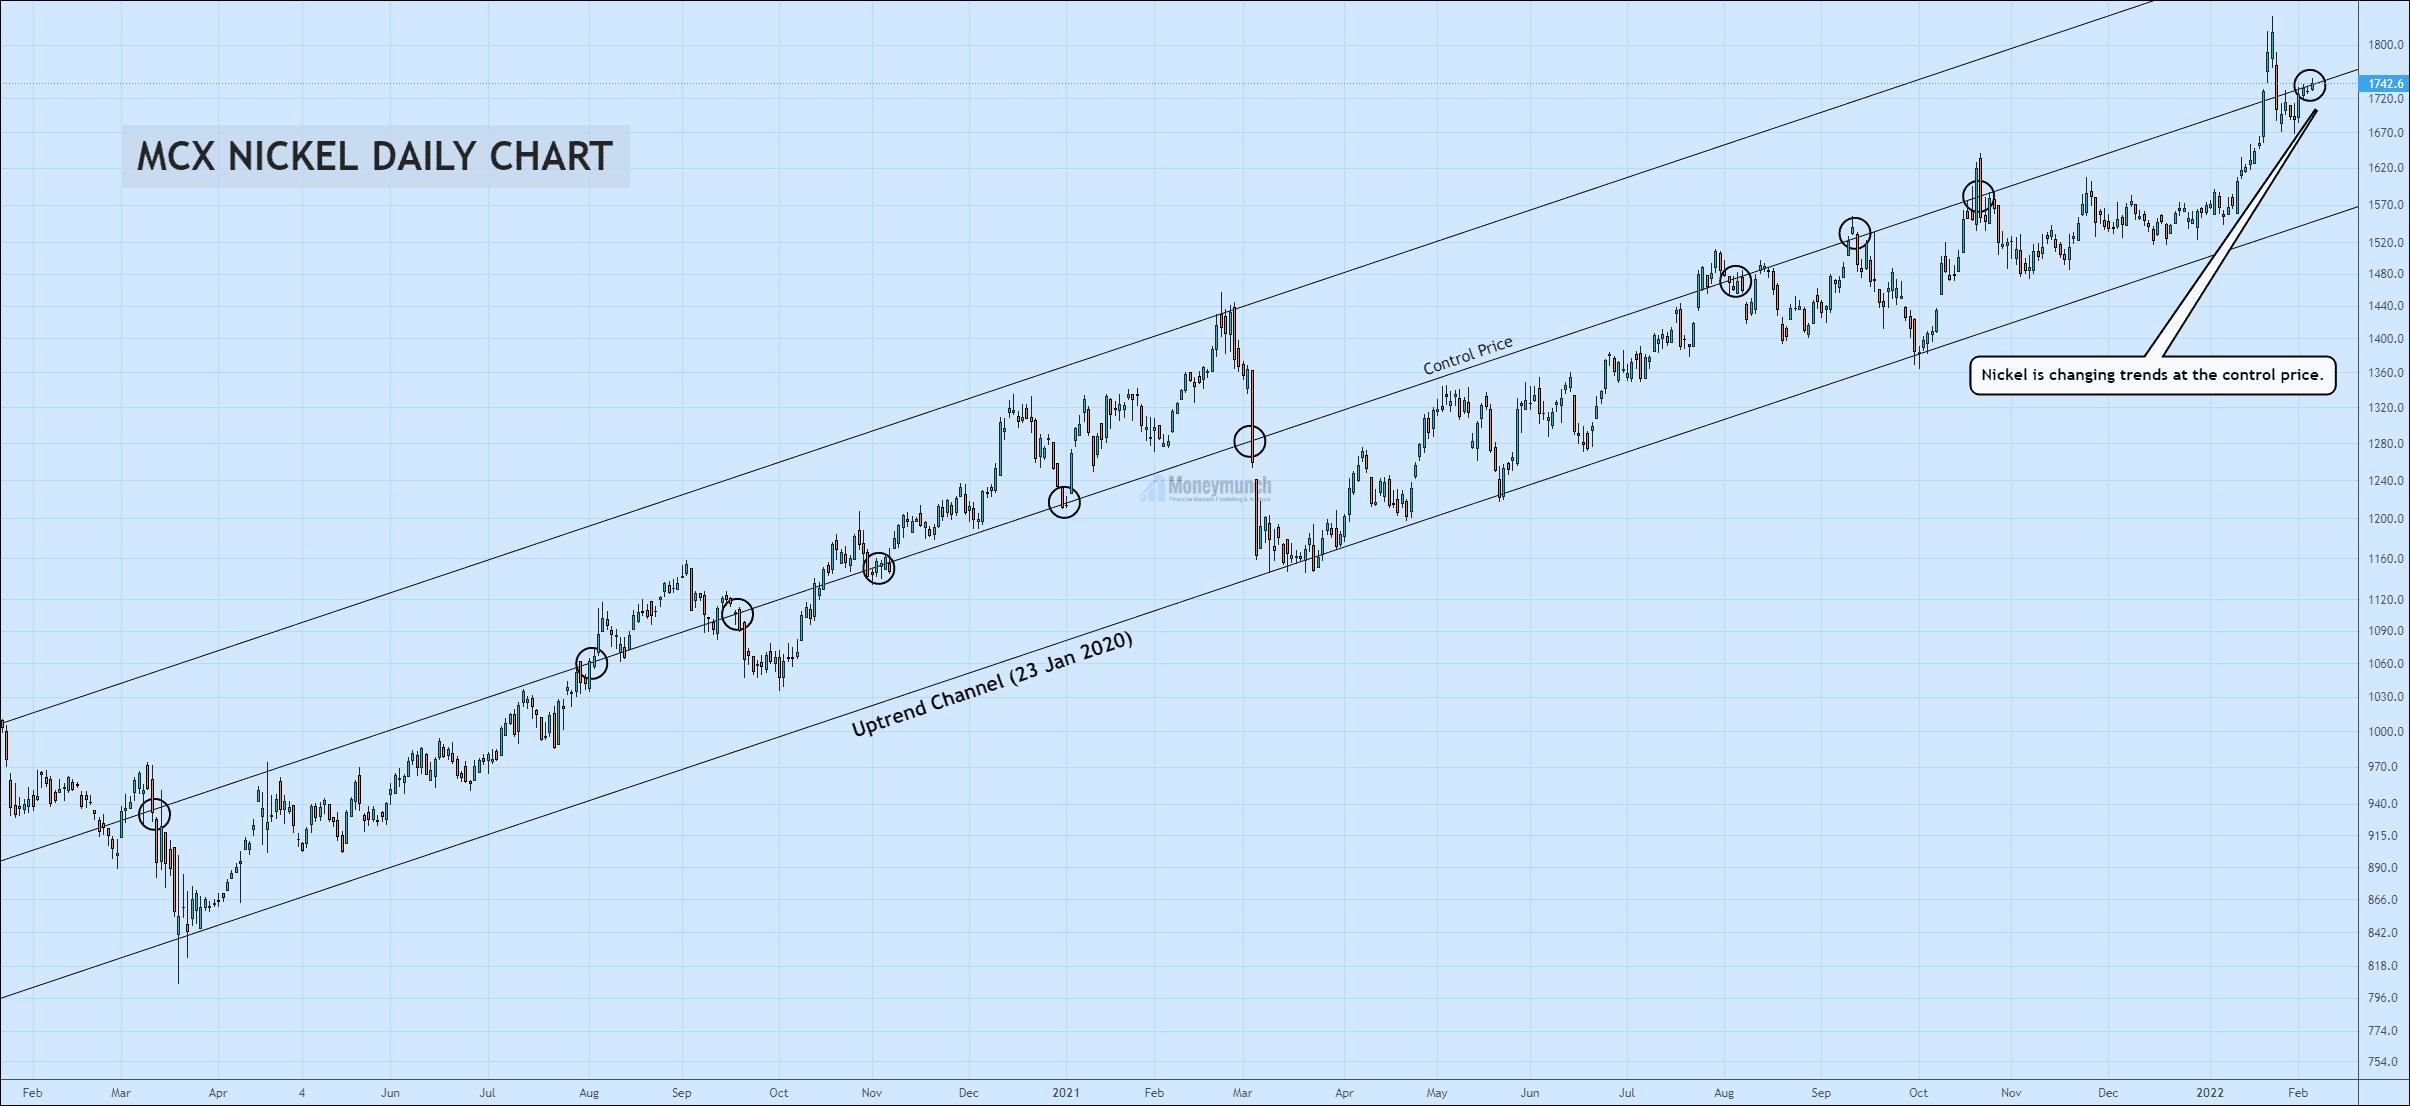
MCX Nickel is following the above uptrend channel from 23 Jan 2020. And making a good trade opportunity for commodity traders. Nickel’s upward trend is not over yet. But we may see a downfall below the control price, and it can be up to 1686 – 1620.

But what happens if it breaks the control price?

It’s a 100% sign for a buy signal. But intraday or short-term investors should confirm that breakout before proceeding. And they must look out for candle’s fakeout. Afterward, be ready for the targets of 1800 – 1840 – 1876+.

To become a subscriber, subscribe to our free newsletter services. Our service is free for all.

Continue reading

NSE PEL Is Preparing for 2400 – 2301

free stock market nse pel chart calls

TARGETS:
Traders can initiate short positions for the following targets:
2400 – 2376 – 2301 – 2279

BUT DON’T TRADE BLINDLY. Read this following research to get how it is making selling opportunities for the intraday traders.

PEL is forming a double combination pattern on the 4-hour timeframe chart. Price has constructed LL(lower-low) and LH(lower-high) to confirm the bear’s existence.

Wave Formations:
Wave (W) is a double zigzag formation with seven wave structures.
Wave (X) is a contracting triangle with five sub-wave structures.

Wave (Y):
Sub-wave wave A & B has occurred, and wave C is progressing.
Sub-wave B has completed at 61.8% Fibonacci retracement of wave A at 2531.

The culmination point of wave C:
Wave C can end at 61.8% of wave A at 2279.
Wave C can cease at 50% of wave A at 2333.
Wave C can conclude at the control line, and 61.8% of wave ((W)) at 2376.
After completion of wave C, the price will start its bull run.

To become a subscriber, subscribe to our free newsletter services. Our service is free for all.

Continue reading

NSE Godawari Power – Money Making Tree

Free nse gpil chart tips

GPIL has formed a downtrend channel for the last six months.
Price has created 5 no trading zones. No trading zone is an area where trading activities haven’t taken place. It has constituted 2 excess on the lower band and 3 rejections, 2 rejections from the upper bend.
The control line has made eight touches.

Currently, the price is on the upper band of the parallel channel.
Don’t forget that price has provided two successful rejections from the upper band.

The trader can initiate a short position for the following targets of 313 – 304 – 290.
Invalidation: Breakout of the parallel channel.

To become a subscriber, subscribe to our free newsletter services. Our service is free for all.

Continue reading

Will ICOMODEX Energy Reach 7500 Before March End?

Free mcx energy index calls

ICOMODEX Energy is forming an impulsive wave 3.

Price has finished the corrective wave (iv) of wave 3, and the price is establishing an impulsive wave (v) of wave 3.

Price is about to make the last leg v. If the price breaks the high of wave iii, it can make an upward move of 7135 – 7290- 7355 -7477.

After the accomplishing of wave 3, the price will fall and break the acceleration channel.

What are the turning points for the prices?

+ Wave 3 can finish at 2.618 (7477) reverse Fibonacci retracements of wave iv.
+ Wave 3 can finish at 2.618 (7167) reverse Fibonacci of wave (iv)
+ 3rd wave can end after the breakdown of sub-channel.

I will upload further information for intraday traders. To become a subscriber, subscribe to our free newsletter services. Our service is free for all.

Continue reading

High confidence Trade-setup for ACE Construction

Free nse stock ACE chart calsl

ACE construction is forming a contracting triangle of waves ((4)).
To draw parallel lines, I have connected wave ((2)) & wave ((4)) and merged with wave ((3)).

Wave ((1))
– Five wave impulse

wave ((2))
– Sharp correction
– 50% retracement of wave ((1))

Wave ((3))
– Five wave impulse
– Power extend

Wave ((4))
– Contracting triangle
– sideways correction
– 38.2% of wave ((3))

Wave ((5))
– Wave ((5)) can be equal to wave ((1)).
– It can end near a 1.618% extension of wave ((4)).

We can expect the following targets of 273 – 292 – 320+ after the breakout of the B-D trend line.

In case, if price breaks the A-C trend line to completed wave E, it can fall up to 139. According to Elliott wave, wave (4) ends near the lower degree of wave 4.

Free nse ACE construction charts calls

In this chart, we can see the crossover of multi-exponential moving averages. And the price is formed a value area for more than two months.
If the price breaks out of this value area range, we may see an upward move for our targets. To become a subscriber, subscribe to our free newsletter services. Our service is free for all.

Continue reading

Nifty Outlook: Is This The Last Pivot zone For The Bears?

Free nse nifty chart tips

After creating the low of 17836, we have seen a price surge to 17623Nifty again reached the pivot zone 17621.

If niftysustains above 17621, traders can buy for the following targets 17680-17765-17841+.

Also, a price above 50EMA indicates the presence of bulls in the current juncture.

Please note that the rejection of the pivot zone indicates that the price is not going above.

Free nse nifty chart tips

Price had broken out of the value area, and I suggested buying nifty after price entered into the parallel channel.
Price has made excess and entered the equilibrium area, where supply equals demand.

Currently, the price is on the control line. It controls the up and down movements inside it.
Nearly every up or down move in the value area stops at this control price line. It is pivotal support and resistance level inside the value area.

It is called pivotal because of how price oscillates around it.
If the price sustains above the control line, we have a butl bulllish scenario for, 17800+ as I mentioned above. But rejection of the control line will drive the price to 17226.

To become a subscriber, subscribe to our free newsletter services. Our service is free for all.

Continue reading