AUDJPY: Will AUDJPY Confirm Its Bull Run?

Free forex currency audjpy chart calls

AUDJPY is forming a contracting triangle. Price had completed the (D) wave, and I have given the short-term selling targets of wave (E) of wave ((4)).

In my previous article, I have mentioned thatWave (E) can complete between 0.618 to 0.786% Fibonacci levels. That’s why a trader can expect the following targets for wave (E) 83.44-82.50-81.03 as targets of wave E”.

Price has reached all of these targets.

Click Here to read the previous article.

The ending point of wave (E) is the starting point of an impulsive cycle.
Due to bearish sentiments, the price may touch the A-C trend line and start the bullish move.

Safe traders can enter after price make an excess on the lower band of the channel.
They can expect the following targets 82.565 – 83.850 – 84.185+.

Invalidation: Breakdown of the A-C trend line.

Continue reading

EURCAD: Bullish Scenario is Active!

Free forex currency eurcad chart calls

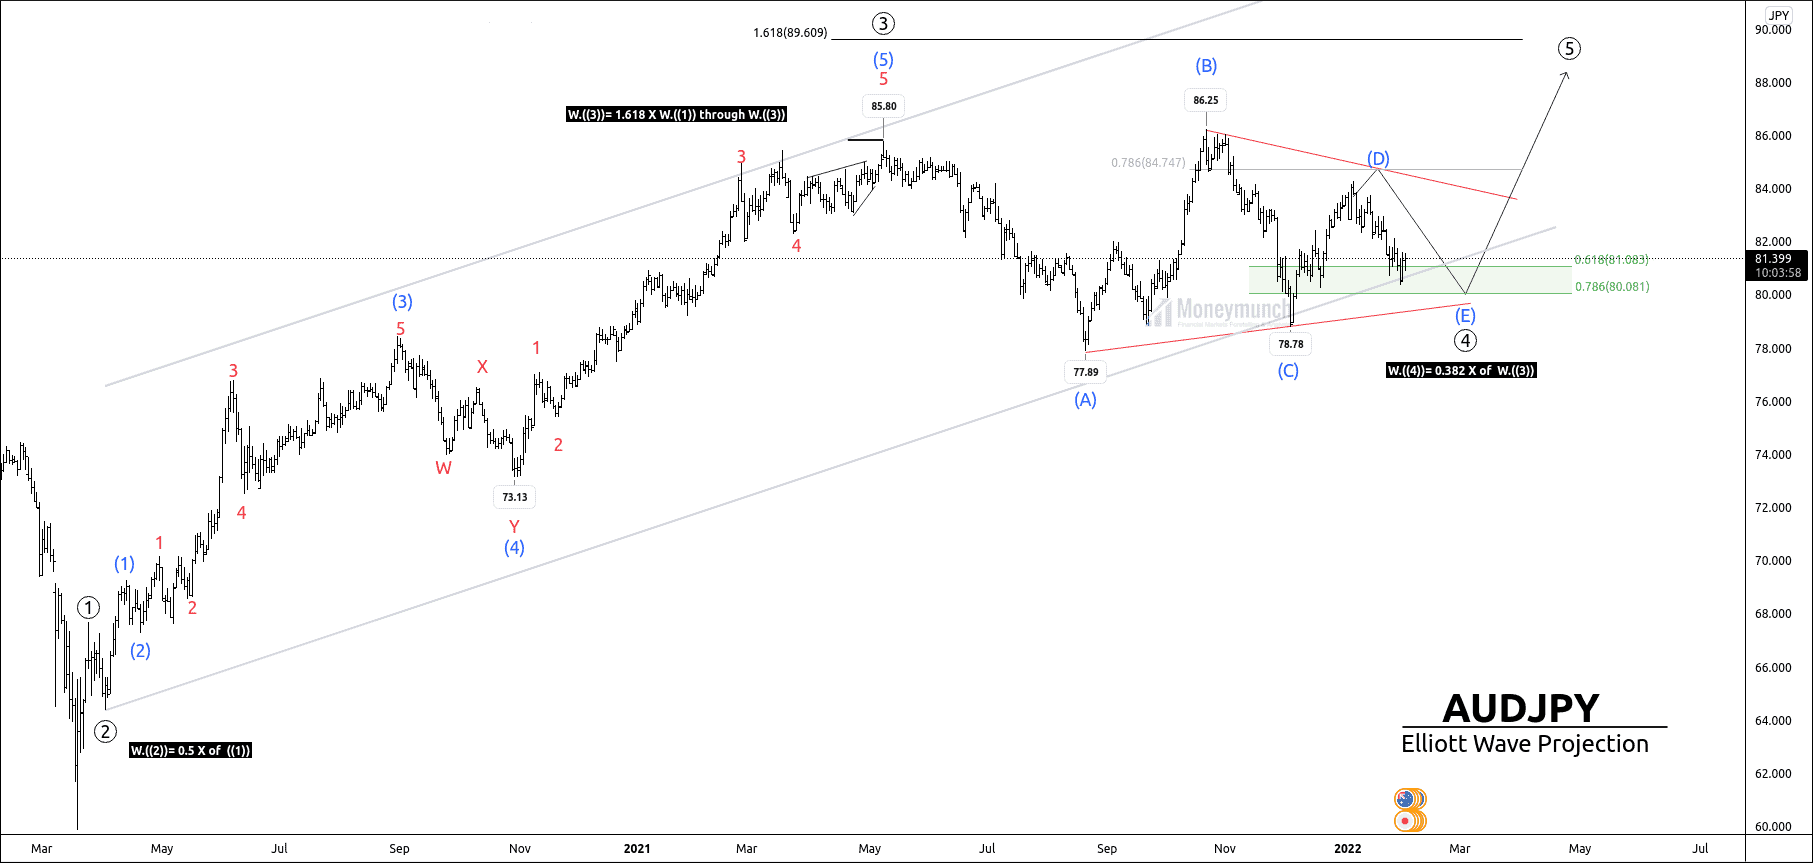
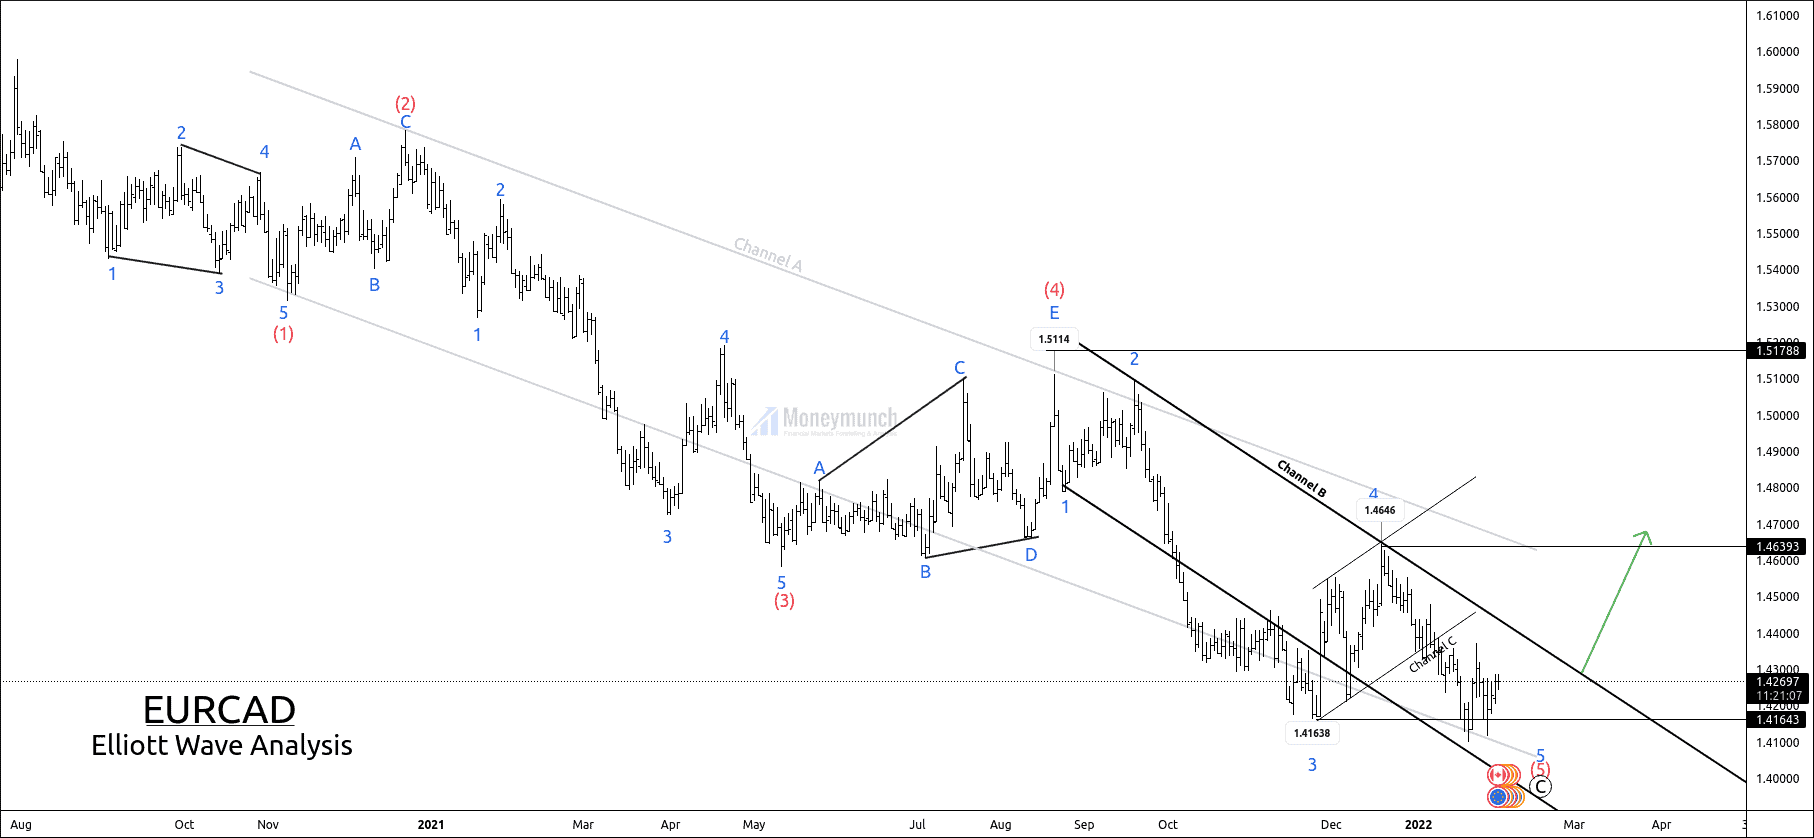
EURCAD is forming a downtrend channel.
Price is establishing a final sub-wave 5 of wave (5).

In my previous idea, I have mentioned that, If the price breaks down channel C, the following targets for Wave 5 will be 1.4313 – 1.42520 – 1.41652- 1.41156.
Price reached all the targets of wave (5).

Click Here to Read previous article.

Currently, the price is heaving correction, but safe traders can enter after the breakout of the C channel.

After making wave (5), if the price breaks the B channel, it can go for 1.4377 – 1.4466 – 1.4569 – 1.4645+. And Price will start a new 5-wave impulse structure. Invalidation is available for premium subscribers.

Please note that without a breakout, trend changes may not be possible.

Get free forex & currency ideas, chart setups, and analysis for the upcoming session: Forex Signals

Want to get premium trading alerts on GBPUSD, EURUSD, USDINR, XAUUSD, etc., and unlimited access to Moneymunch? Join today and start potentially multiplying your net worth: Premium Forex Signals

Premium features: daily updates, full access to the Moneymunch #1 Rank List, Research Reports, Premium screens, and much more. You΄ll quickly identify which commodities to buy, which to sell, and target today΄s hottest industries.

Have you any questions/feedback about this article? Please leave your queries in the comment box for answers.

Disclaimer: The information provided on this website, including but not limited to stock, commodity, and forex trading tips, technical analysis, and research reports, is solely for educational and informational purposes. It should not be considered as financial advice or a recommendation to engage in any trading activity. Trading in stocks, commodities, and forex involves substantial risks, and you should carefully consider your financial situation and consult with a professional advisor before making any trading decisions. Moneymunch.com and its authors do not guarantee the accuracy, completeness, or reliability of the information provided, and shall not be held responsible for any losses or damages incurred as a result of using or relying on such information. Trading in the financial markets is subject to market risks, and past performance is not indicative of future results. By accessing and using this website, you acknowledge and agree to the terms of this disclaimer.

NSE – Nifty Tips & Update

Before:

Free nse nifty chart calls

Price was out of the value area, and It has given 78.6% retracement of the previous move.

To maintain equilibrium, However, price should enter into the value area.

The lower band indicates a crucial demand zone. But if the price fails to break the lower band, supply will exceed the demand.

Click here to read previous research report.

After:

Free nse index nifty 50 chart analysis and tips

Price has entered into the value area, and price surged to the control line, which is the controller of any particular trend move.

I have mentioned it in bold words,” At this juncture, the price has entered the value area. The lower band indicates the demand pressure. The price will surge towards 17369- 17487-17612.

28th January 2022: 

12:15 PM – Price entered into the value area. The first target of 17369 has reached, and the price has made a high of 17373.

1st February 2022: 

9:15 AM – Price has reached the second target of 17487.

12:00 PM – Price reached the final target of 17612.

To become a subscriber, subscribe to our free newsletter services. Our service is free for all.

Continue reading

EWT: Will Crude Oil Reach 7000?

Free mcx crude oil chart tips

Crude oil is forming impulsive waves ((5)).

After the completion of wave ((3)), the price had started complex running flat of the corrective wave ((4)).
Wave B has crossed the high of wave ((3)), but wave B couldn’t break the low of wave A.

Price has made a failure of swing low, which was a rejection of a downtrend, and crude oil gained momentum.
Price has exceeded the sub-wave B of wave ((4)).

Sub-wave 4 of wave ((5)) is in progress.

If their price breaks out the high of wave 3, we can expect the following target for final sub-wave 6697-6785-6865+. It means the price has bullish sentiments above wave three and vice versa.
Breakout of the parallel channel shows the weakness of the impulsive wave. Note that wave four can never overlap the starting point of wave 1.

To become a subscriber, subscribe to our free newsletter services. Our service is free for all.

Get free MCX ideas, chart setups, and analysis for the upcoming session: Commodity Tips

Have you any questions/feedback about this article? Please leave your queries in the comment box for answers.

Disclaimer: The information provided on this website, including but not limited to stock, commodity, and forex trading tips, technical analysis, and research reports, is solely for educational and informational purposes. It should not be considered as financial advice or a recommendation to engage in any trading activity. Trading in stocks, commodities, and forex involves substantial risks, and you should carefully consider your financial situation and consult with a professional advisor before making any trading decisions. Moneymunch.com and its authors do not guarantee the accuracy, completeness, or reliability of the information provided, and shall not be held responsible for any losses or damages incurred as a result of using or relying on such information. Trading in the financial markets is subject to market risks, and past performance is not indicative of future results. By accessing and using this website, you acknowledge and agree to the terms of this disclaimer.

Nifty Outlook: Is This The End Of The Bull Market?

Free nse nifty chart calls

After breaking the parallel channel, the price entered the value area.

Price has started a seller initiative by going out of the price zone.
Buyers responded more to sellers’ initiatives with an excess.

At this juncture, the price has entered the value area.
The lower band indicates the demand pressure.

If the price does not stay above the lower band at 17250, it could move downwards to the lower levels – 16628-16410, because the price didn’t break the 78.6% level.
Otherwise, the price will surge towards 17369- 17487-17612.

Note that if the price does not break the control line, it can not reach the upper band.

To become a subscriber, subscribe to our free newsletter services. Our service is free for all.

Continue reading

Nifty Outlook: Will the seller crash the remaining bull?

Free nse nifty chart calls

Nifty is occurring a corrective wave ((iv)) on the hourly timeframe chart.
It has broken the previous corrective (iv) of a lower degree and price fall to 17377.

The bullish scenario is valid till the price is above 17150.
According to the Elliott wave principle, wave ((iv)) can never enter the price territory of wave ((i)).

Wave ((iv)) has retraced 78.6%, and it can’t retrace more than 78.6% if there is a bull power on the other hand. If the nifty breaks 78.6% at 17156, it will also break the invalidation level point of 17150.

Nifty is creating a downtrend channel, where bull power has controlled by sellers.
If the price breaks out of the channel downtrend, we can see a sharp upward move soon.
However, nifty has to confirm its bull run by breaking the breaking supply zones.

No bullish scenario without breakout of the parallel channel.

If the price breaks the downtrend channel, trader can buy for the following targets of 17435-17618-18125

To become a subscriber, subscribe to our free newsletter services. Our service is free for all.

Continue reading