EWT – AUPJPY Is Ready For The Last Target

Before:

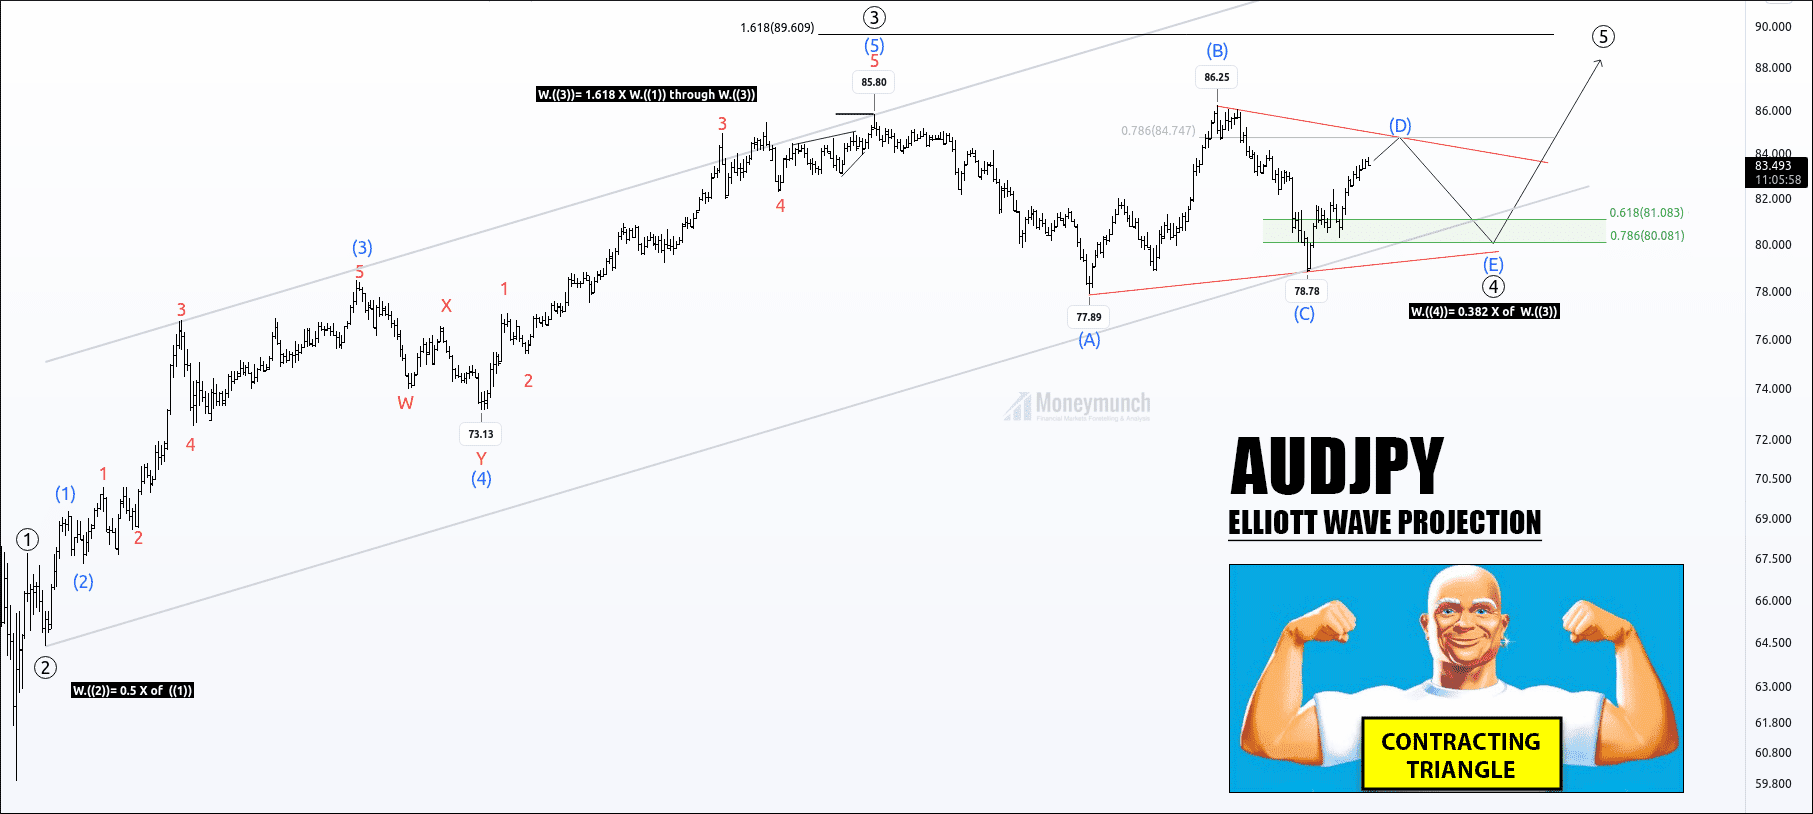
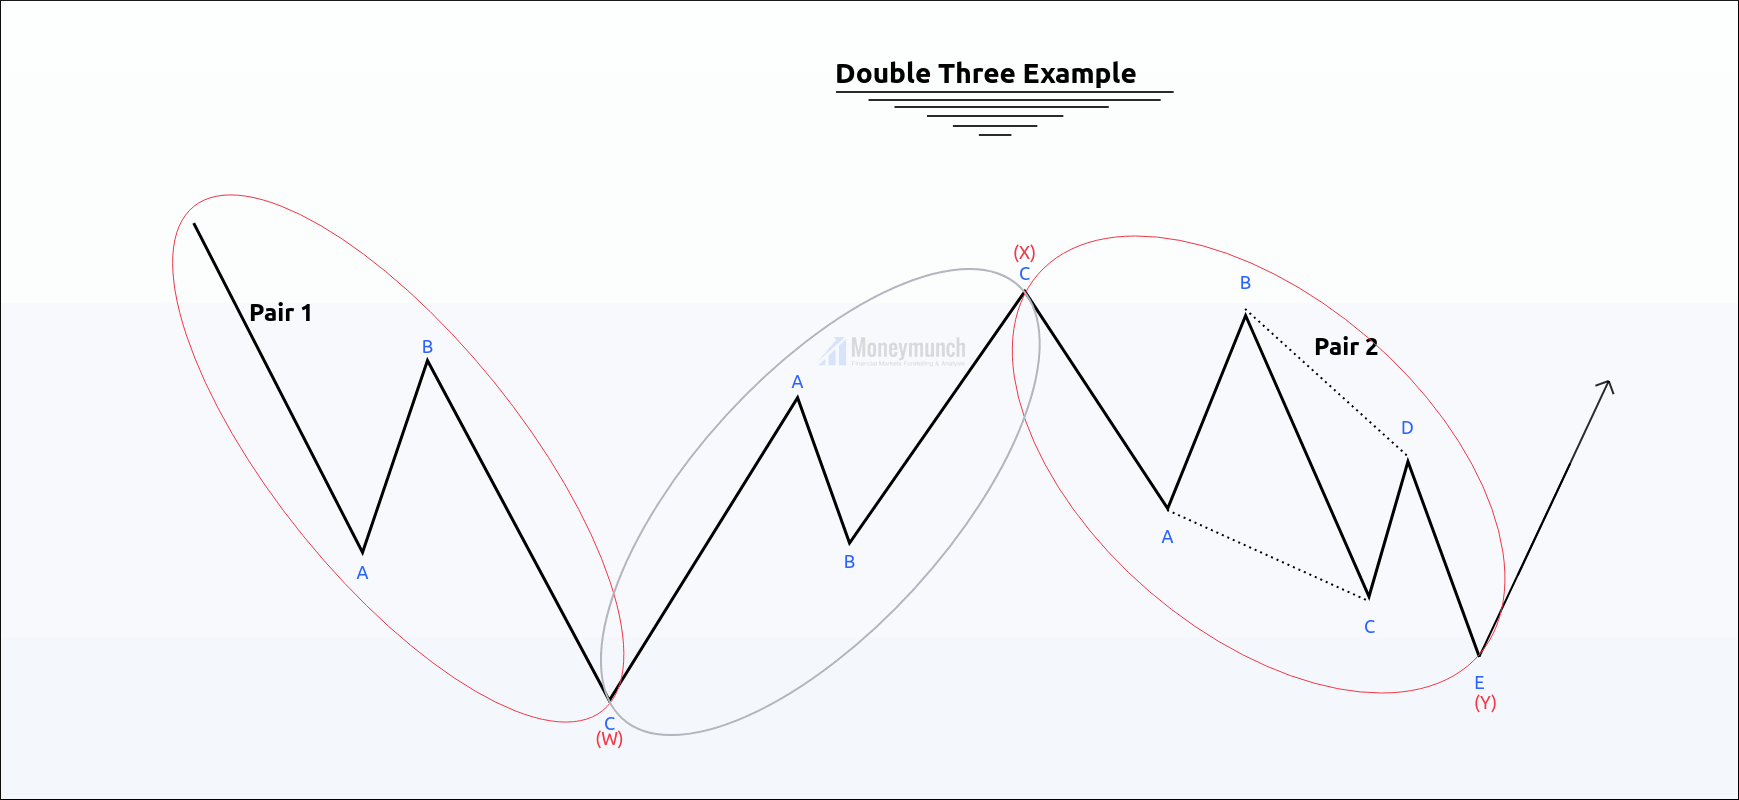
AUDJPY is forming a contracting triangle of corrective wave E.

Wave D was near to accomplish, and the price had bearish sentiments, where it was a beginning phase of wave E.

I had written in clear words, “Wave (E) can complete between 0.618 to .786 Fibonacci levels. That’s why a trader can expect the following targets for wave (E) 83.44-82.50-81.03 as targets of wave E. If you want to trade wave (E), then you should have a trailing stop due to the high volatility of wave (E)”.

Click here to read previous research report.

After:

free forex currency audjpy chart tips

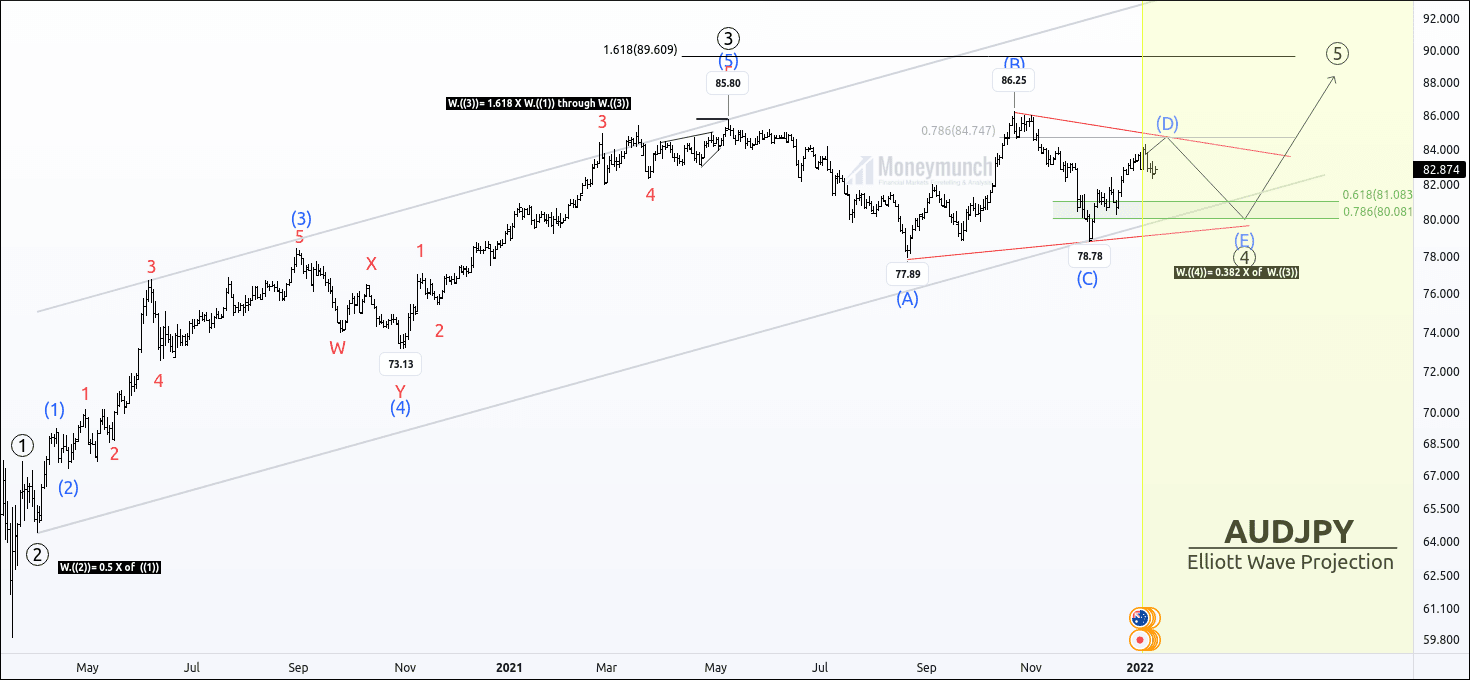
Price has made a high at 84.302.

5 January 2022, the price made reached the first target of 83.44

10 January 2022, the price reached the second target of 82.50. Price had made a recent low of 82.32.

Get free important share market ideas on stocks & nifty tips chart setups, analysis for the upcoming session, and more by joining the below link: Stock Tips

Have you any questions/feedback about this article? Please leave your queries in the comment box for answers.

Disclaimer: The information provided on this website, including but not limited to stock, commodity, and forex trading tips, technical analysis, and research reports, is solely for educational and informational purposes. It should not be considered as financial advice or a recommendation to engage in any trading activity. Trading in stocks, commodities, and forex involves substantial risks, and you should carefully consider your financial situation and consult with a professional advisor before making any trading decisions. Moneymunch.com and its authors do not guarantee the accuracy, completeness, or reliability of the information provided, and shall not be held responsible for any losses or damages incurred as a result of using or relying on such information. Trading in the financial markets is subject to market risks, and past performance is not indicative of future results. By accessing and using this website, you acknowledge and agree to the terms of this disclaimer.

EWT – Gail is Going To Break 2021’s High

free nse stock gail chart calls

Gail India has completed its 4th corrective wave, where wave C is the last leg of correction.

Price took 27 weeks to complete the corrective wave ((4)).
After completing the wave ((4)), the price has broken the sub-wave iv and signaled a rally. It also has entered into the corrective channel, and this rally can make a new higher high.

The traders can expect the following targets 149-156-170+ for impulsive wave ((5)).

To become a subscriber, subscribe to our free newsletter services. Our service is free for all.

Wave Formations:

Wave ((1)) started to form an extreme low at 65.
– Leading diagonal

Wave ((2)) has retraced 0.618% of wave ((1)).
– Zigzag correction

Wave ((3)) has extended 2.618% of wave ((1)).
– Five wave impulse

Wave ((4)) has retraced 0.5% of wave ((3))
– Extended wave 5

Continue reading

Nifty FUT Trade Setup For Subscribers

To become a subscriber, subscribe to our free newsletter services. Our service is free for all.

Continue reading

Is Silver(XAGUSD) Ready For Trend Change?

free forex currency xagusd silver chart calls

Silver(XAGUSD) has formed a downtrend channel for more than 48 weeks. Price has made a high of 30.03, and sellers entered the market.

Price Action Perspective:

Price has made a series of Lower Highs and Lower Lows, and the control line gives nine touches.

According to Dow theory, if the price breaks the previous LL, it will make a new LL. The upper band & lower band has provided strong reversals to the price.

After breaking the LL, if the price gives a breakout of the downtrend channel, it indicates the worst fundamentals. And if the price gets reversed to create the lower band of the downtrend channel, the price will march to the upper band touch.

Elliott Perspective:

Price has constituted a corrective structure, where price has completed double zigzag(w-x-y).

It will create the last leg wave Z in order to complete the Triple correction. After making the last leg Z, silver will start a five-wave impulsive wave.

To become a subscriber, subscribe to our free newsletter services. Our service is free for all.

Continue reading

Will Gold (XAUUSD) Reach $2050 Before December 2022?

free forexcurrency xauusd gold chart calls

XAUUSD is forming a triangle on the wave ((4)).

This correction has taken more than 17 months, but the triangle is not over yet. Price has completed wave D of the 4th wave triangle, and wave E of wave A is in progress.

After completing the wave sub-wave A, the price will start wave B & then wave C.

The ending point of wave E is the starting point of the impulsive cycle.

Calculation of wave E:

Wave E can end 100% of wave sub-wave A at 1726.

Wave E can end near previous sub-wave B at 1719

Wave E can end at 100% of wave D at 1704.

Traders can wait for the breakout of the B-D trend line. Note that if the price doesn’t break the B-D channel, sideways will be continued.

To become a subscriber, subscribe to our free newsletter services. Our service is free for all.

Continue reading

NSE Mothersumi: EWT Double Three Structure

It looks like mother Sumi has completed the 4th wave correction, and the ending point of the corrective wave (4) is the starting point of wave (5).

free nse stock mothersonsumisys chart calls

Wave formations:
Waves W is a zigzag correction pattern.
Wave Y triangle.
Wave X could form any correction pattern.
Wave X is smaller than wave W & Y.

Rules and objectives:

1. Double three is a corrective structure that includes more than one type of corrective pattern.
2. It consists of three waves, which are marked W-X-Y.
3. A triangle may occur only as wave Y in a double three.
4. In most cases, double threes are not deep corrections.
5. wave Y usually ends at 100% – 161.8% Fibonacci extension relative to wave W.
6. Wave Y should not go below the 161.8% Extension of Wave W. It shows that the corrective trend is strong.

What are the double threes?

Price picks up momentum when it starts an impulsive wave.
After accomplishing the impulsive wave, it corrects the previous move by a three-wave pattern.
These three waves were not enough to complete correction because of the high momentum & directional power of an impulsive wave.
Price creates another three-wave move to complete the correction by merging through intermediate wave X.[b][/b]

Let me make it easy by explaining and structuring examples.

Double three Structure:

free nse stock mothersumi chart calls

How to labialize it?

free nse stock mothersumi double three calls

Real Example:

free nse stock mothersonsumi doublethree real chart

To become a subscriber, subscribe to our free newsletter services. Our service is free for all.

Continue reading