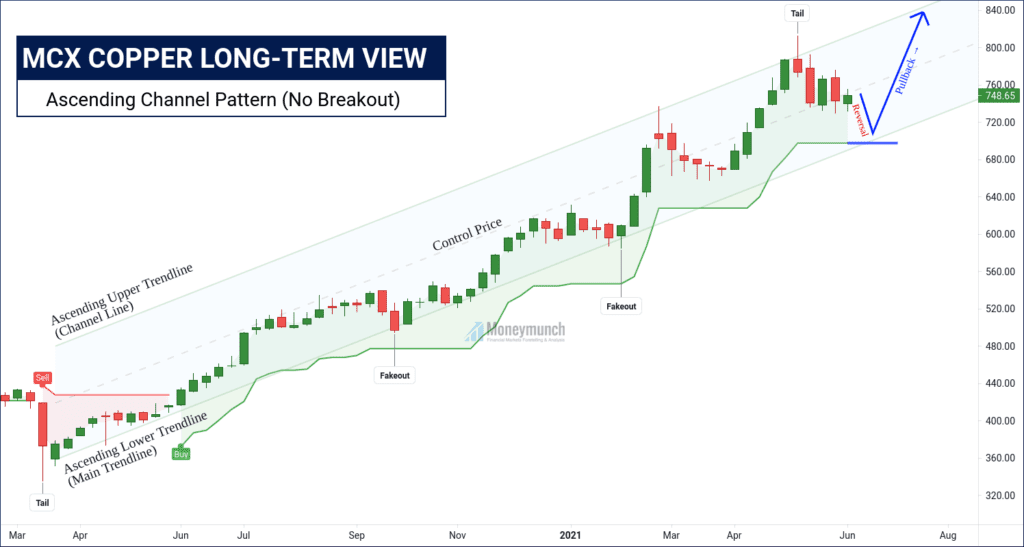

Look at the above weekly chart of MCX Copper. It has created an ascending channel pattern without breakout. This channel started in the previous year’s April month. At present, it’s falling after making a tail. But how much it can go down? Copper may fall more from here, and that can be up to 728 – 710.6 levels.
But overall, it’s on an uptrend. So, soon it will start marching for the following levels:
760 – 780 – 800 – 820 – 840+
To become a subscriber, subscribe to our free newsletter services. Our service is free for all.
Get free MCX ideas, chart setups, and analysis for the upcoming session: Commodity Tips →
Have you any questions/feedback about this article? Please leave your queries in the comment box for answers.
Disclaimer: The information provided on this website, including but not limited to stock, commodity, and forex trading tips, technical analysis, and research reports, is solely for educational and informational purposes. It should not be considered as financial advice or a recommendation to engage in any trading activity. Trading in stocks, commodities, and forex involves substantial risks, and you should carefully consider your financial situation and consult with a professional advisor before making any trading decisions. Moneymunch.com and its authors do not guarantee the accuracy, completeness, or reliability of the information provided, and shall not be held responsible for any losses or damages incurred as a result of using or relying on such information. Trading in the financial markets is subject to market risks, and past performance is not indicative of future results. By accessing and using this website, you acknowledge and agree to the terms of this disclaimer.
Follow the instructions