NSE COPPER: Short-term Projection along with Bigger Picture Analysis
Timeframe: Daily
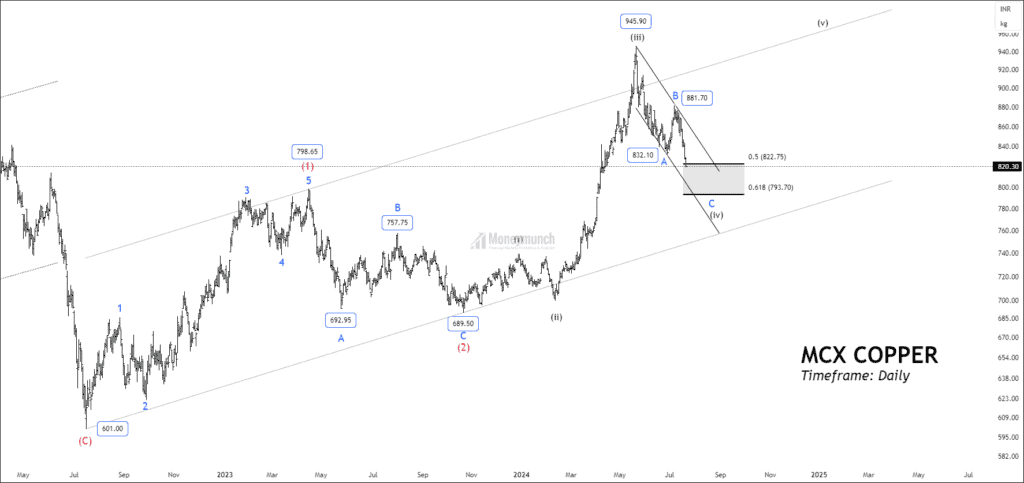
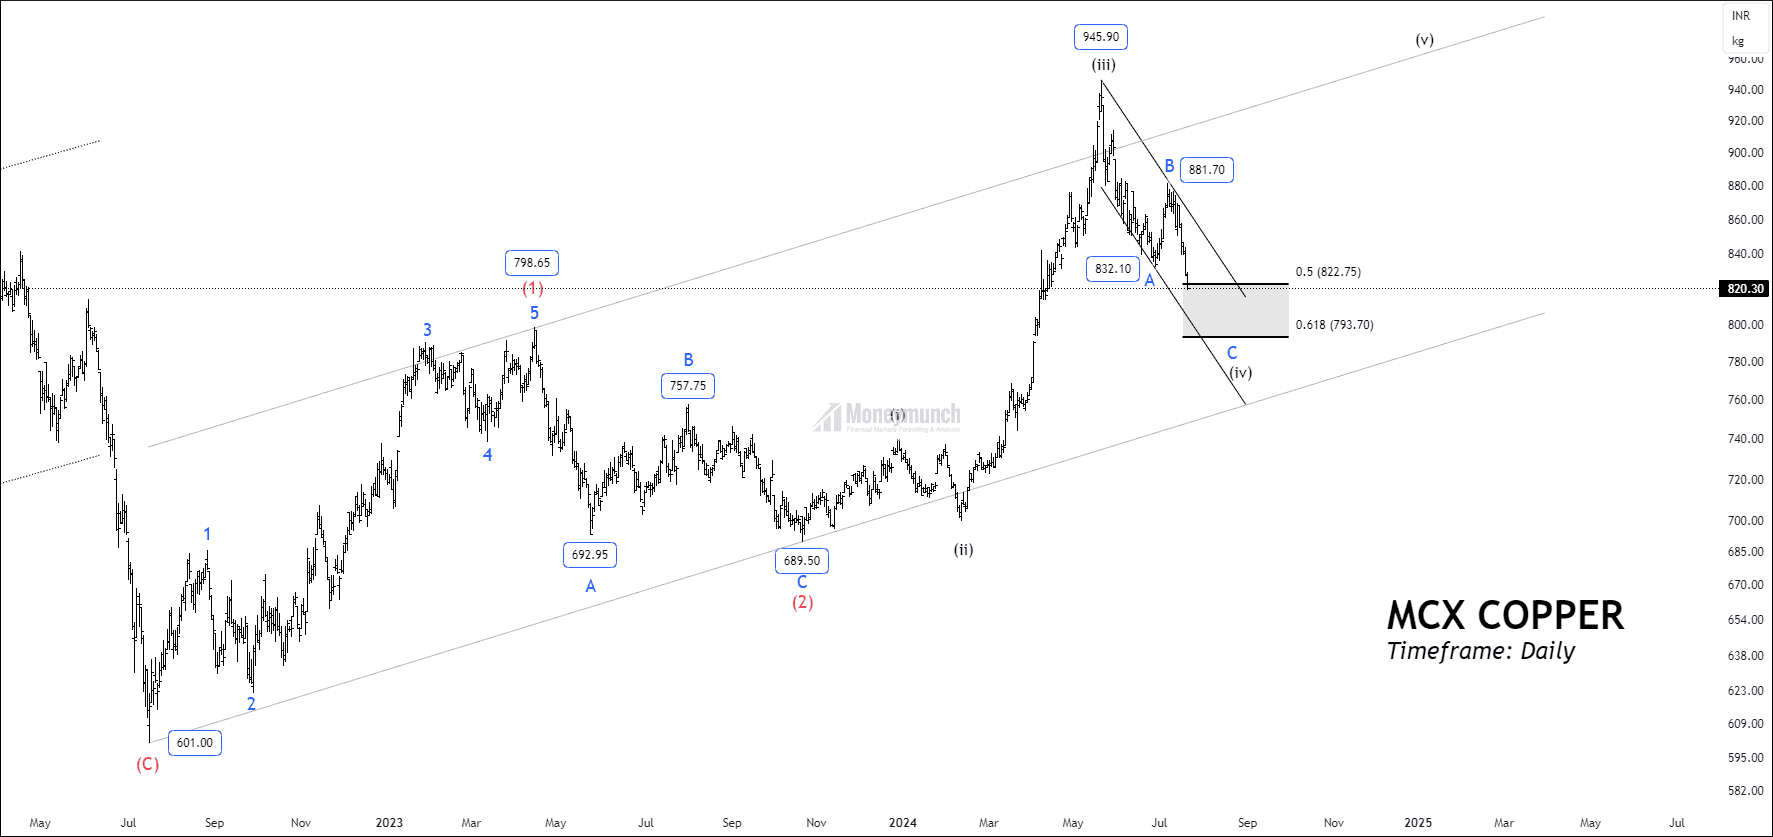
In our previous article, we achieved a significant profit by capturing wave (III) in MCX copper. Currently, MCX copper has completed wave (III) and has initiated wave (IV). The price has recently broken below the 100–day EMA and is now trending downwards towards the 200–day EMA. This indicates a potential continuation of the corrective phase. The Average True Range (ATR) of the price is 13.92, suggesting a moderate level of volatility in the market. Meanwhile, the Average Directional Index (ADX) is at 18.25, indicating a weak trend strength at this stage.
According to the Elliott wave principle, the commodity has accomplished wave B of wave (iv) at 881.7 and started falling for final wave C of wave (iv). Traders can trade this downward move with the following targets: 814 – 806 – 800 – 790+. Wave C can occur near its common retracement levels, such as 61.8% or 100% of wave A.
Only Premium subscribers will have access to further information.
NSE ALUMINIUM – Corrective Formation
Timeframe: Hourly
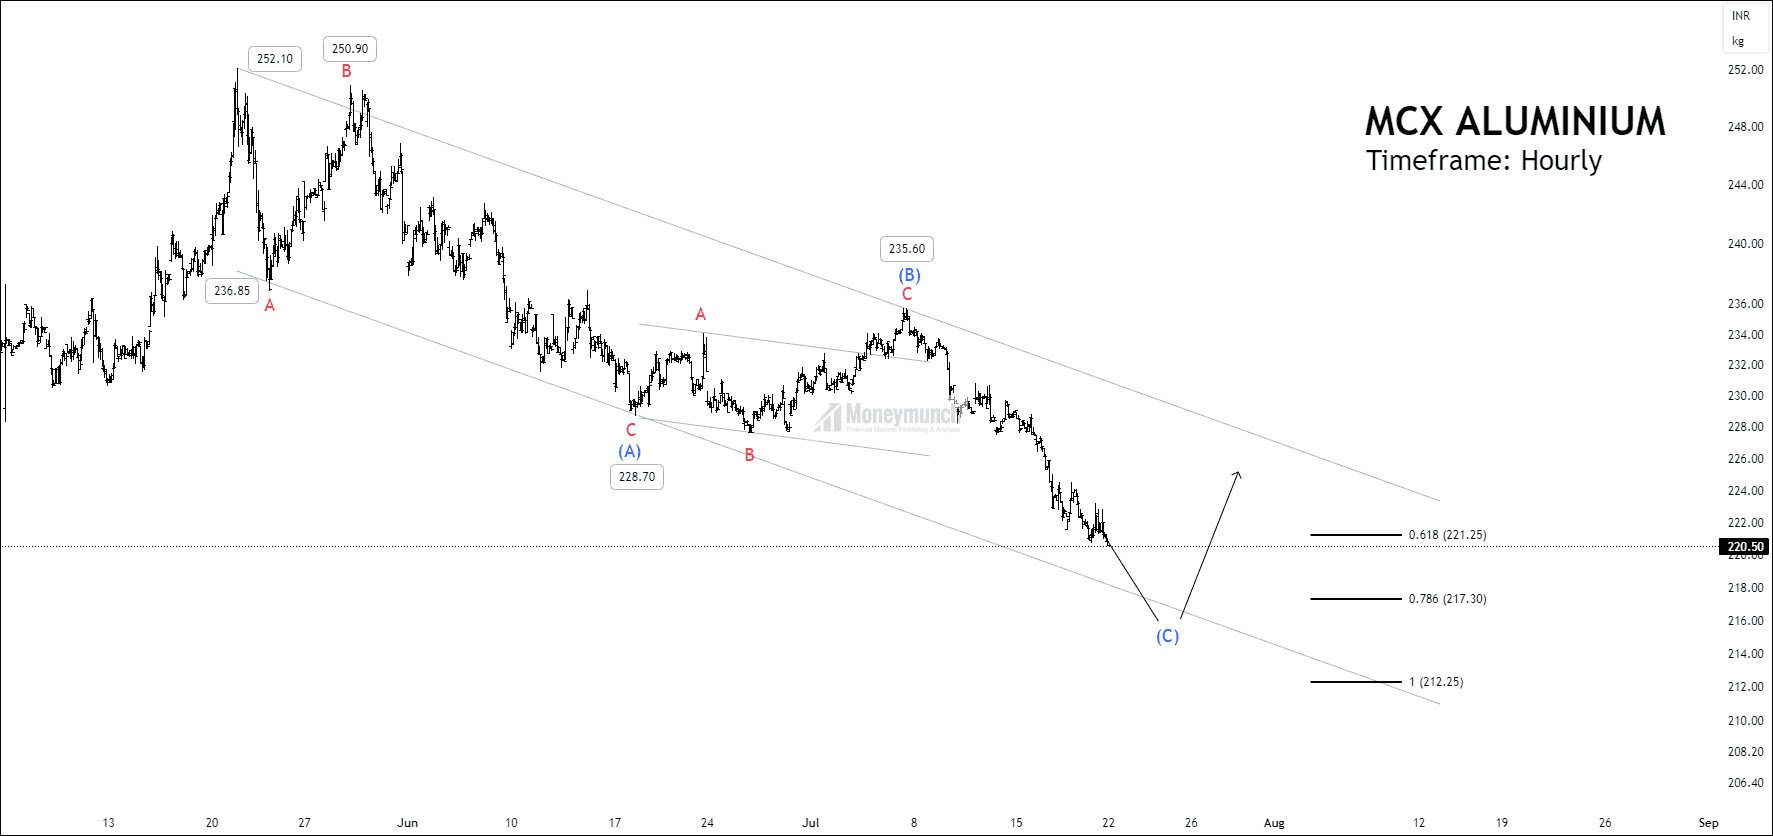
MCX Aluminium has completed wave (B) at 235 and has begun its descent into the final wave (C) of the corrective cycle. The security prices are trading below the 20, 50, 100, and 200 EMAs. The ADX has decreased to 23.20, while the ATR has dropped to 0.77.
The downward move can extend to 100% of wave A, equating to wave B. After wave (B) is formed, bulls are expected to dominate the ensuing impulsive cycle. Traders have the opportunity to establish a short-term sell setup with the following targets: 218 – 216 – 212.6+ .
Premium subscribers will have access to further information.
NSE CRUDE OIL – Multiple Scenario Analysis
Timeframe: Daily
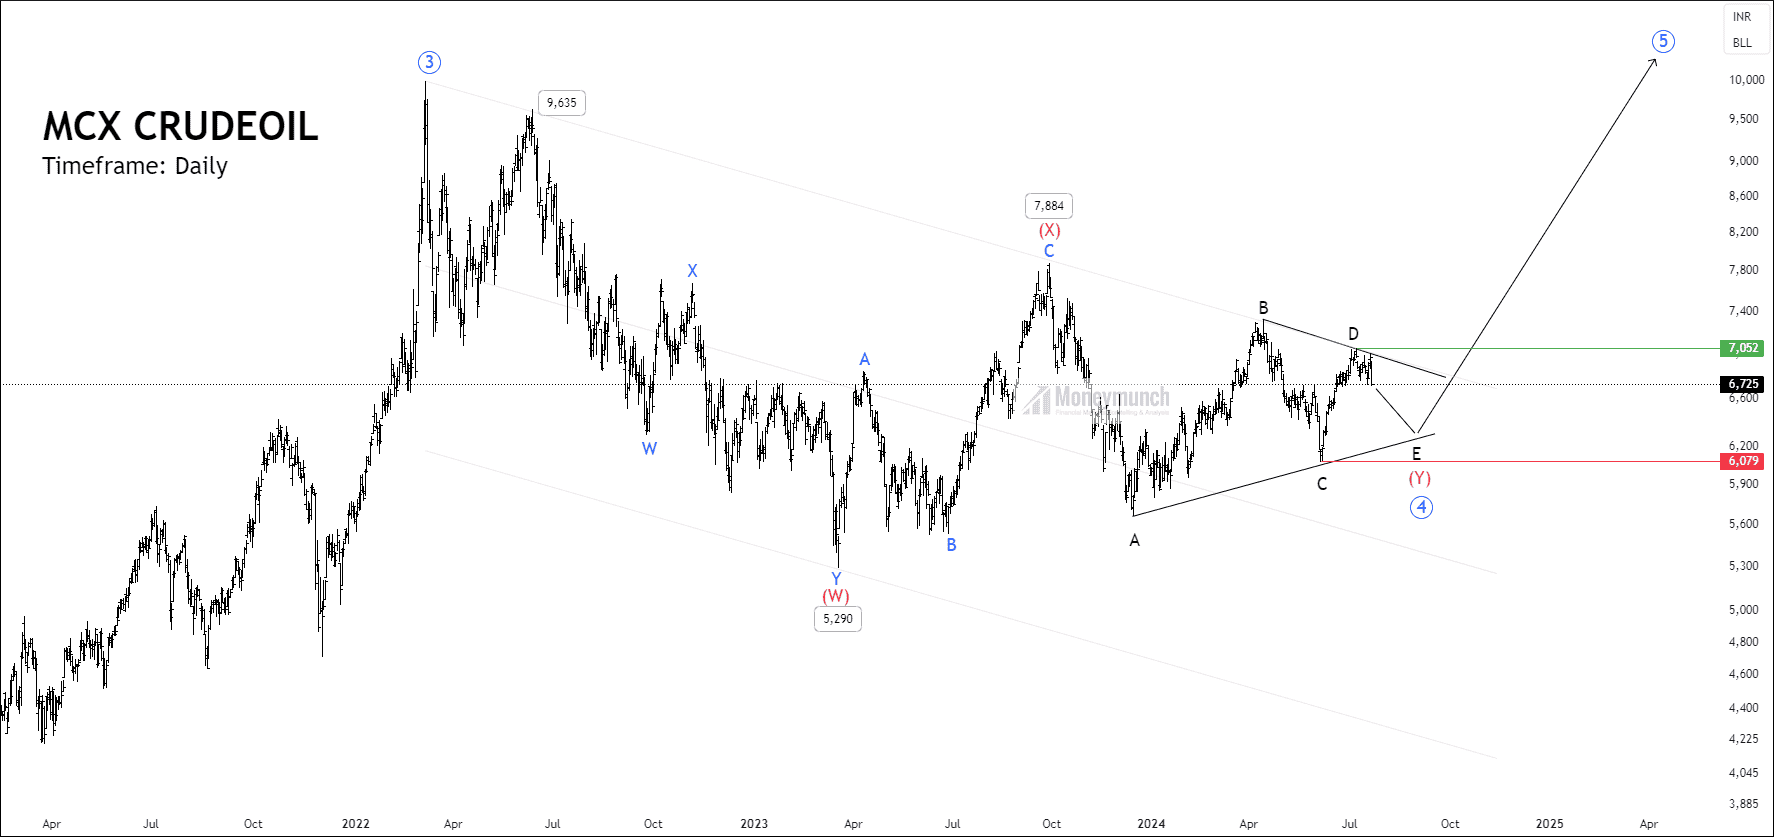
MCX Crude Oil has completed wave ((3)) at 9996 and has begun its corrective wave ((4)). Due to the sideways movement, the 20, 50, 100, and 200 EMAs have remained flat for the past 23 months. The ADX of the price has decreased to 16.03, indicating a weak trend, while the ATR of the price has dropped to 128, suggesting reduced volatility.
Wave Formation:
Wave (W) – Double Zigzag
Wave (X) – Large flat
Wave (Y) – Triangle
Wave ((4)) – Double three formation
The commodity price has begun forming wave E of wave (Y) of wave ((4)). Traders should closely monitor the A-C-E line to identify an optimal entry point for an upward move.
We will update further information for premium subscribers soon.
Get free MCX ideas, chart setups, and analysis for the upcoming session: Commodity Tips →
Have you any questions/feedback about this article? Please leave your queries in the comment box for answers.
Thanks for the copper update! Can you update your views on silver?
Just Wow!
Accurate analysis using wave theory