TECHM CALL: Buy from the Bottom
Today we updated NSE TECHM trade setup at 9:02 AM.
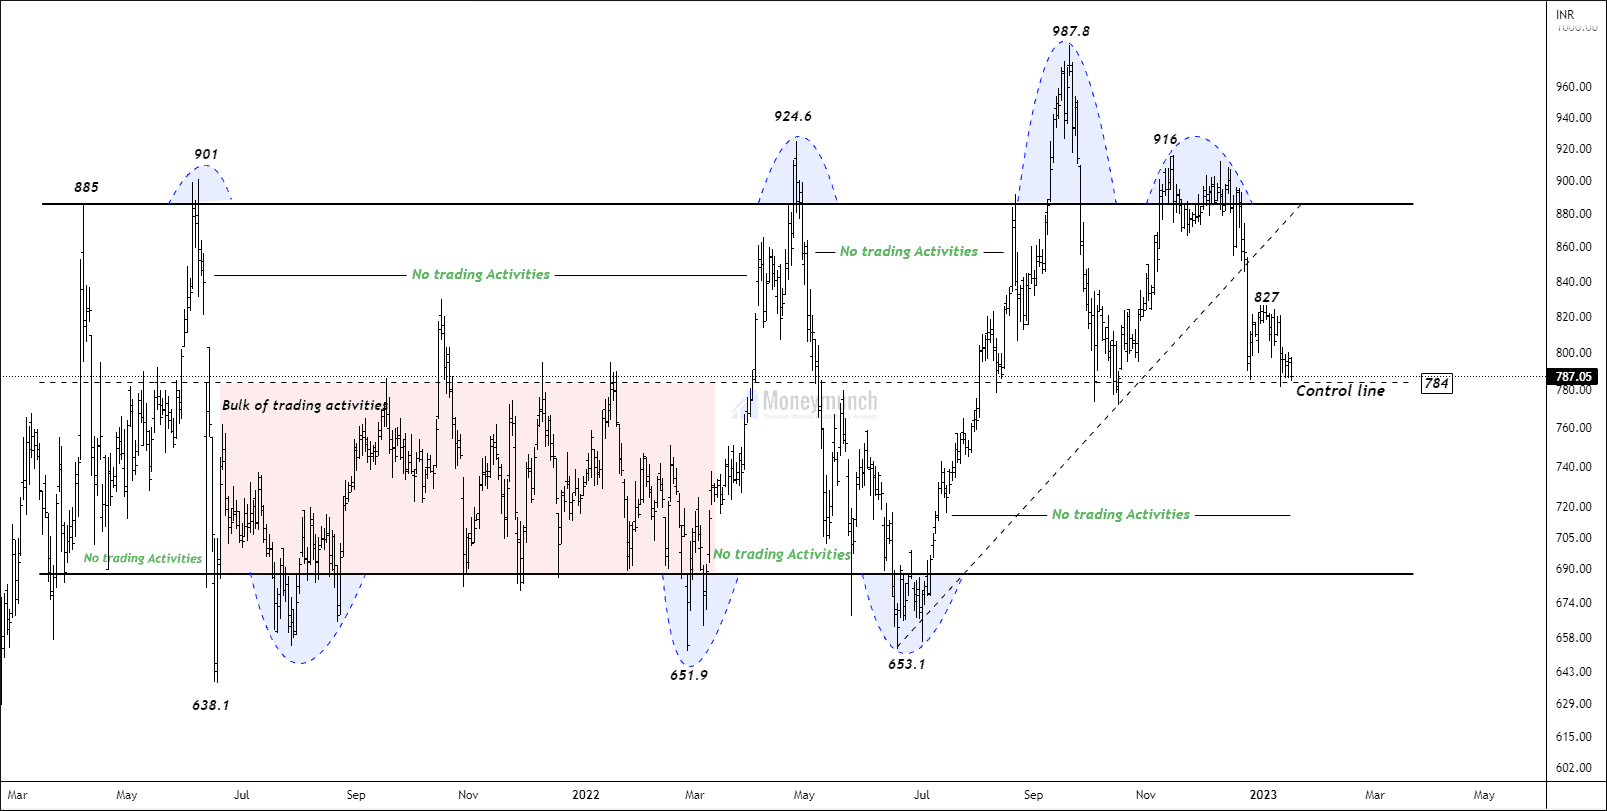
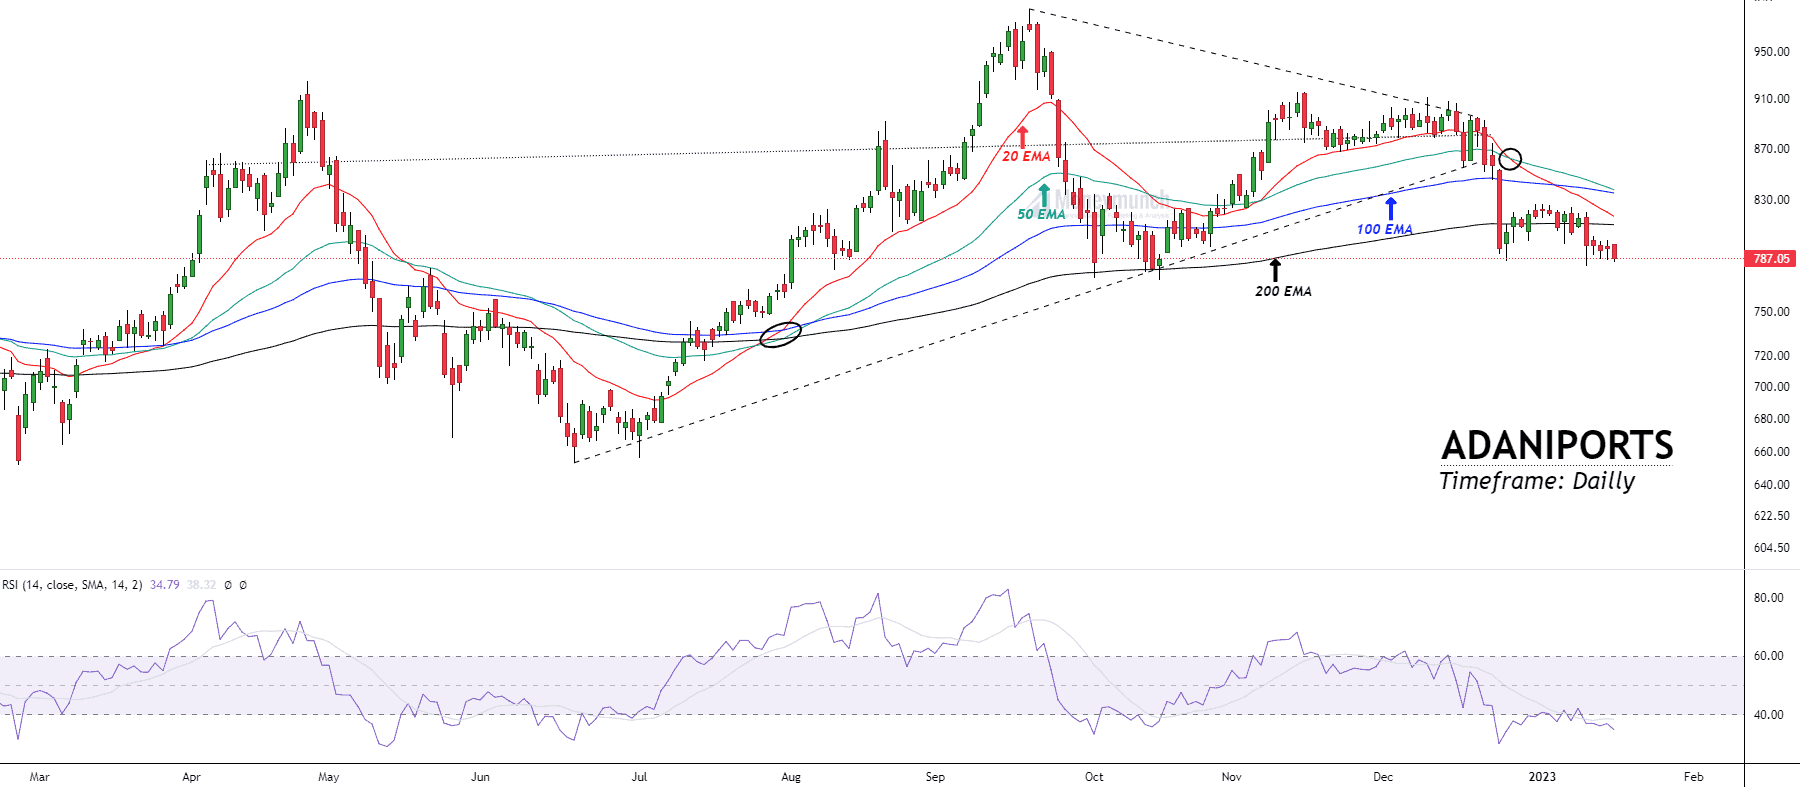
Visit here: Trade Setup – NSE ADANIPORTS, AXISBANK, BEL & More
I have mentioned clearly, “Traders can initiate a long position if the price sustains above 1025 for the following targets: 1042 – 1060 – 1088.”
Timeline:
- 10:15 AM – Price reached the first target of 1042.