
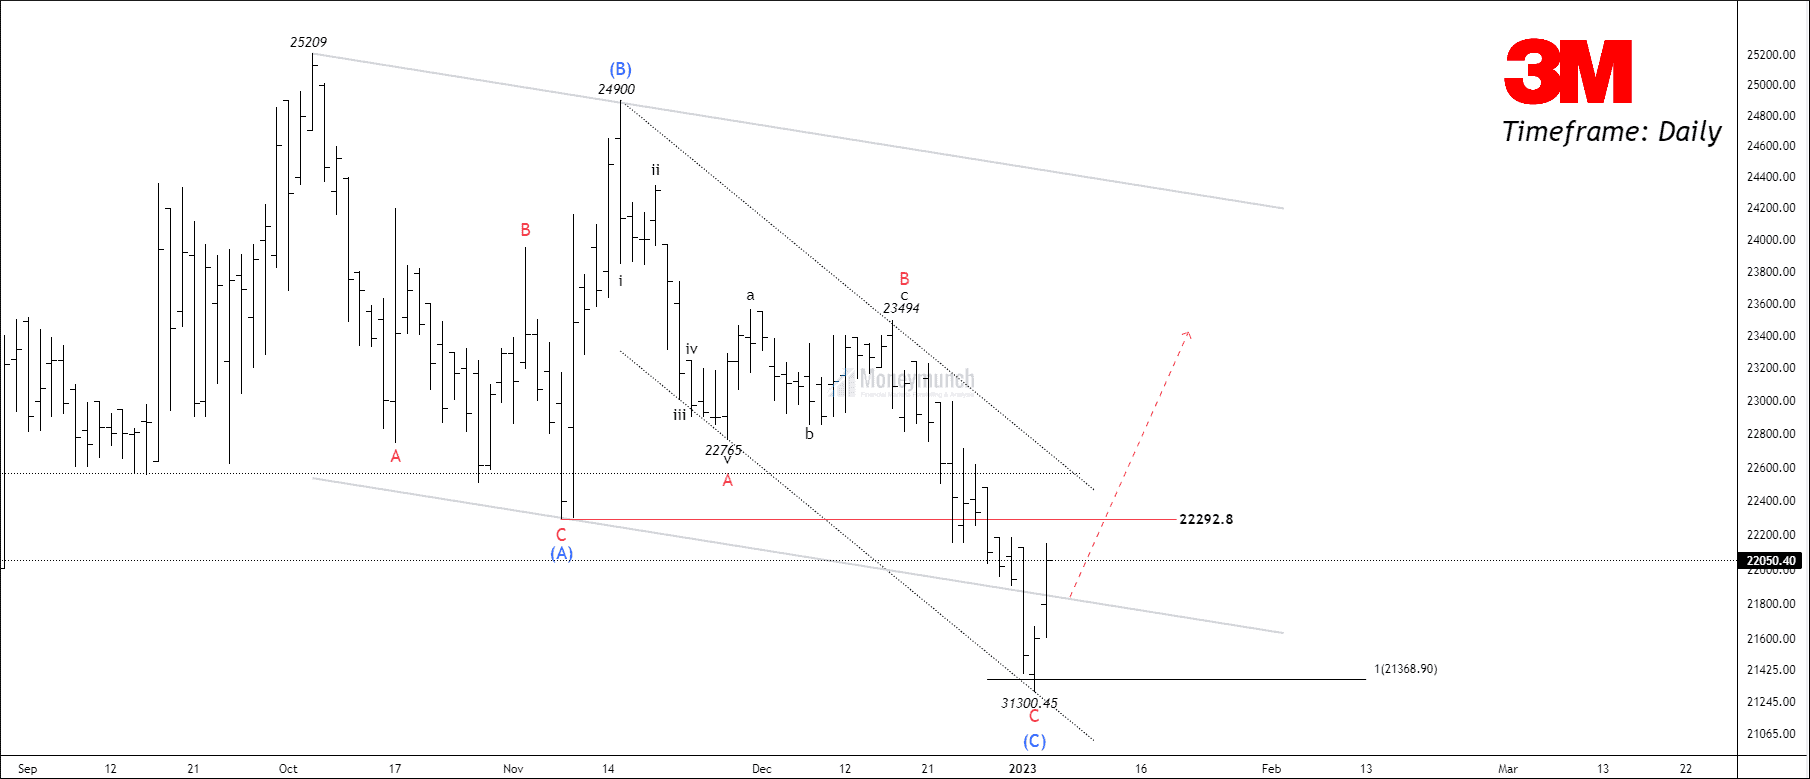
Did you trade the NSE Britannia Trade setup?
Click here: NSE BRITANNIA – THE LAST MOVE OF CORRECTION
NSE Britannia Crushed The Buyers
 Continue reading
NSE BPCL Trade Setup For Subscribers
 Unlock This Article
Only subscribers can read the full article. Please login to read the entire article.
NSE BRITANNIA – Tips & Update
Did you trade the NSE Britannia Trade setup?
Click here: NSE BRITANNIA – THE LAST MOVE OF CORRECTION
 Continue reading
NSE MCX – Elliott Wave projection
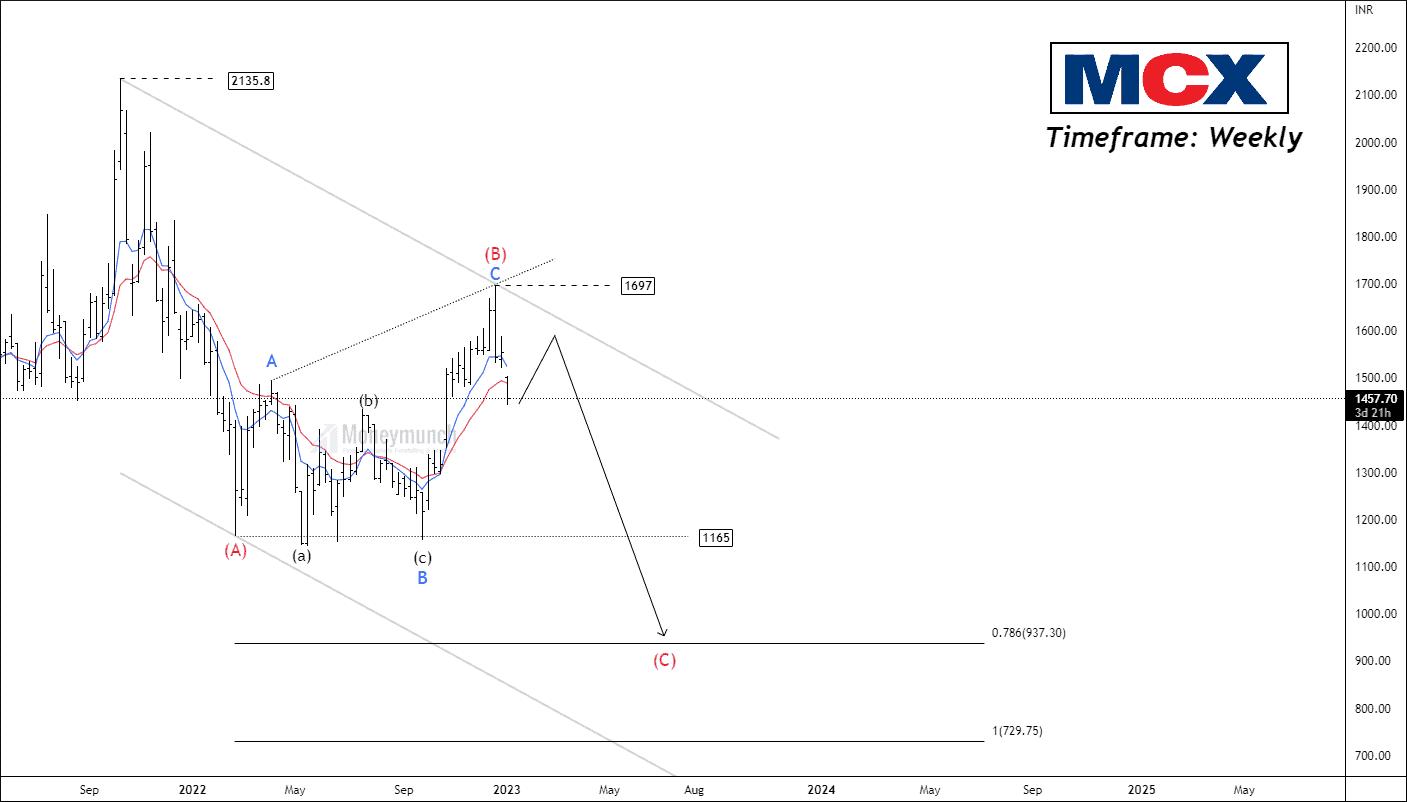
Timeframe: Weekly
Prices are forming in the corrective structure A-B-C. Wave B has accomplished at 1697, and wave C is ongoing. We can see a window(gap-down) after the breakdown of the 7 and 14 Exponential moving averages, which shows a sharp decline.
Safe traders should wait for a pullback and sell only if the price trade below the 1700 level. Traders can trade for the following targets: 1336 – 1164 – 937.
As soon as the price pulls back, I will upload this idea for subscribers.(To become a subscriber, subscribe to our free newsletter services. Our service is free for all.)
Only subscribers can read the full article. Please login to read the entire article.
Continue reading
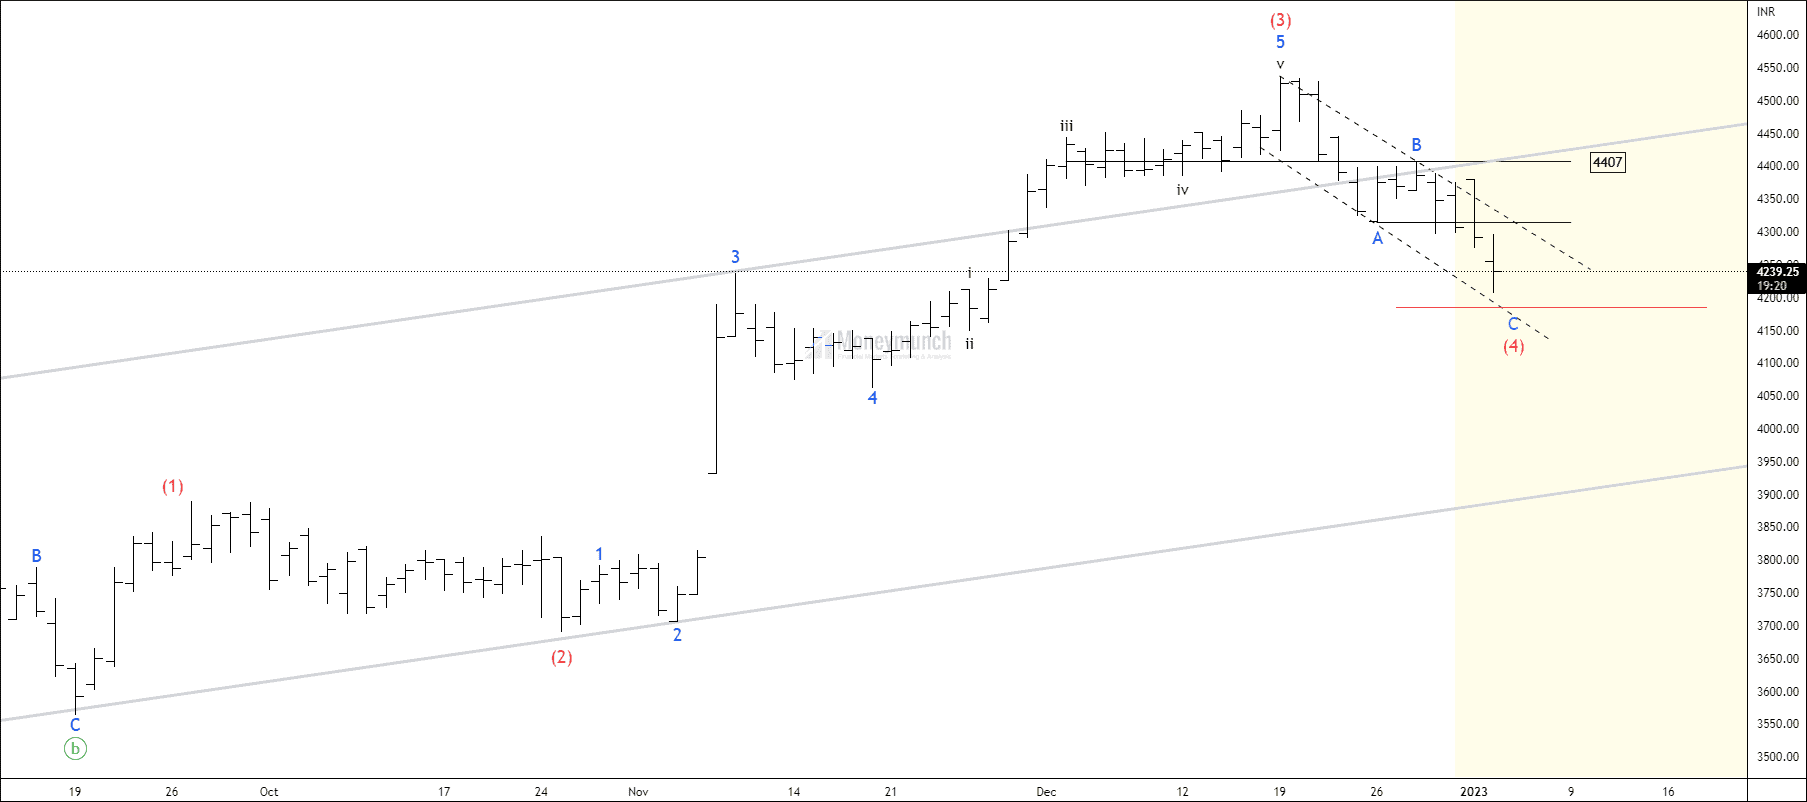
NSE Britannia – The Last Move of Correction
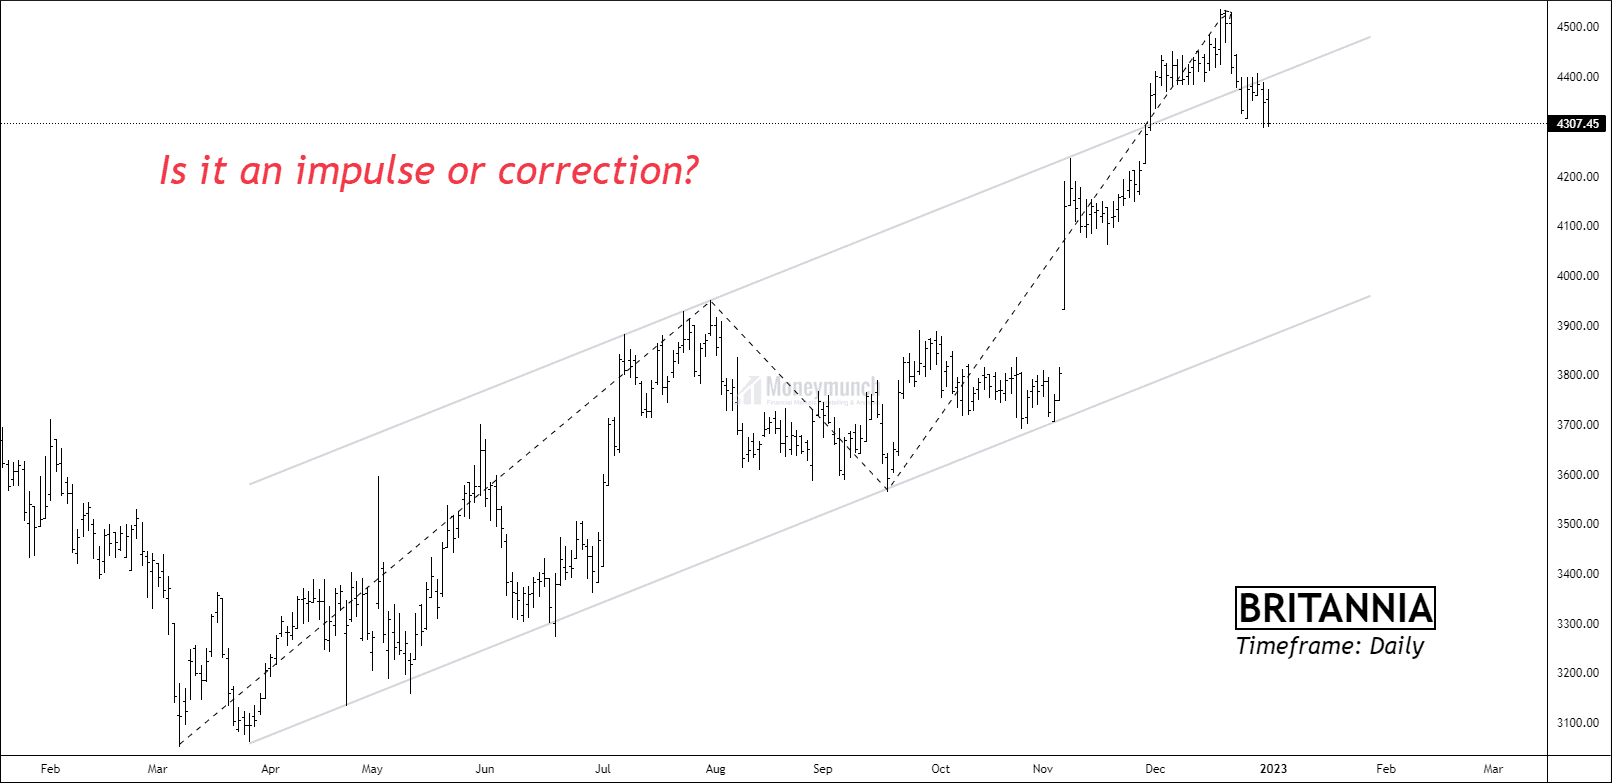
Timeframe: Daily
NSE Britannia has formed a new cycle from 3050. Although the wave cycle is directional, it cannot be classified as an impulse structure. Impulsive waves have the following characteristics:
- Wave 3 never be the shortest wave among 1, 3, and 5.
- Wave 2 can never retrace 99% of wave 1.
- Wave 4 can never enter the price territory of wave 1.
- Waves 2 and 4 must show alternation in either price, time & pattern.
If the price does not follow these rules, traders must label the cycle as a correction. Take a look at the chart, and tell me if you think the structure is an impulse.
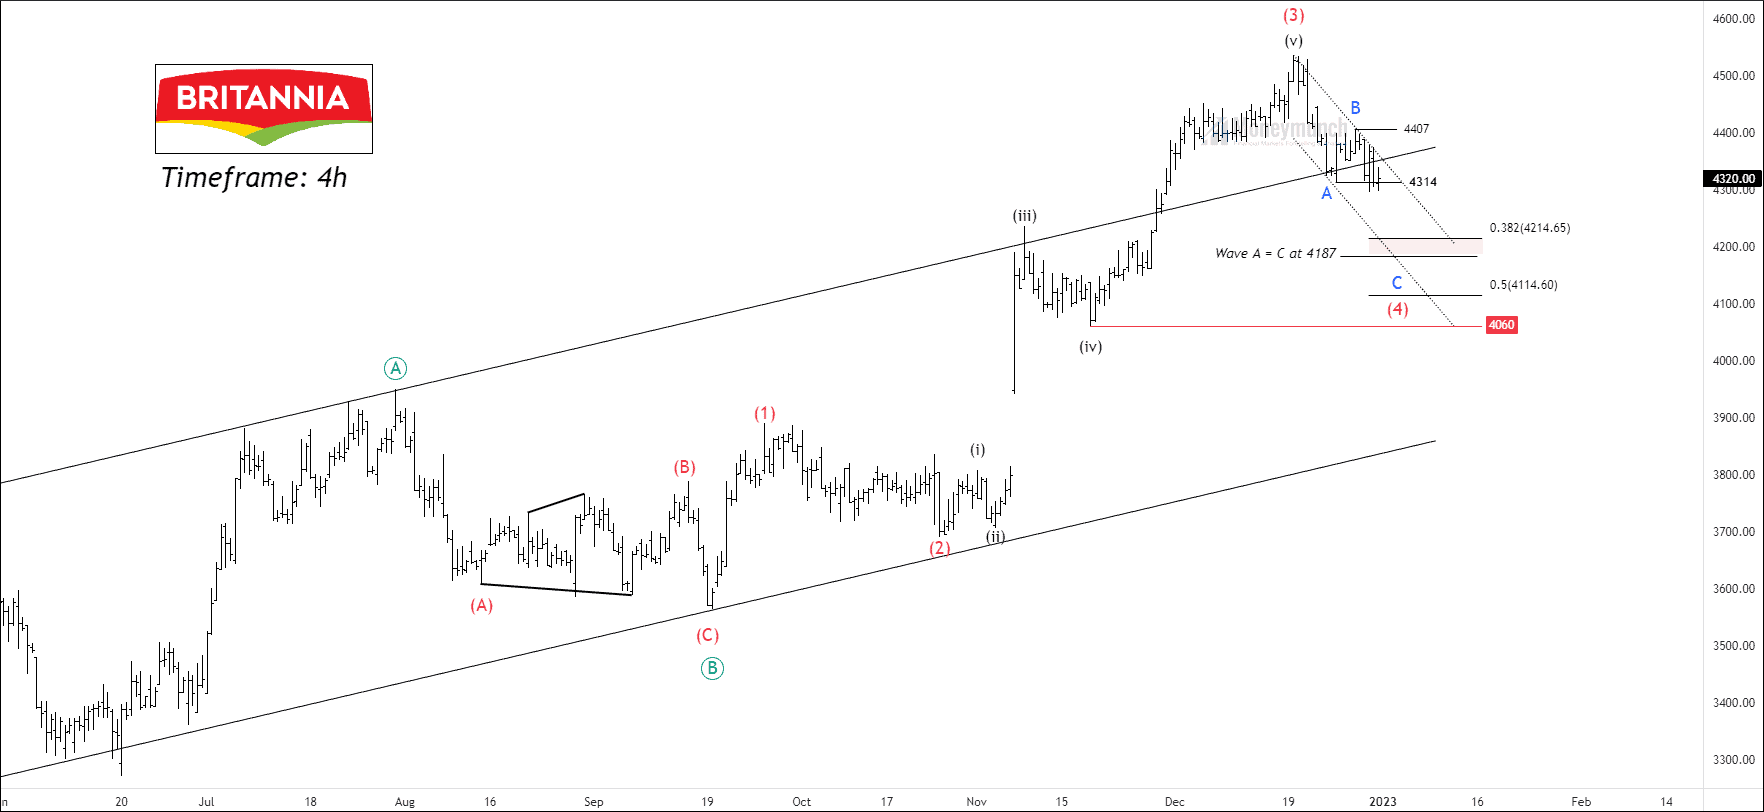
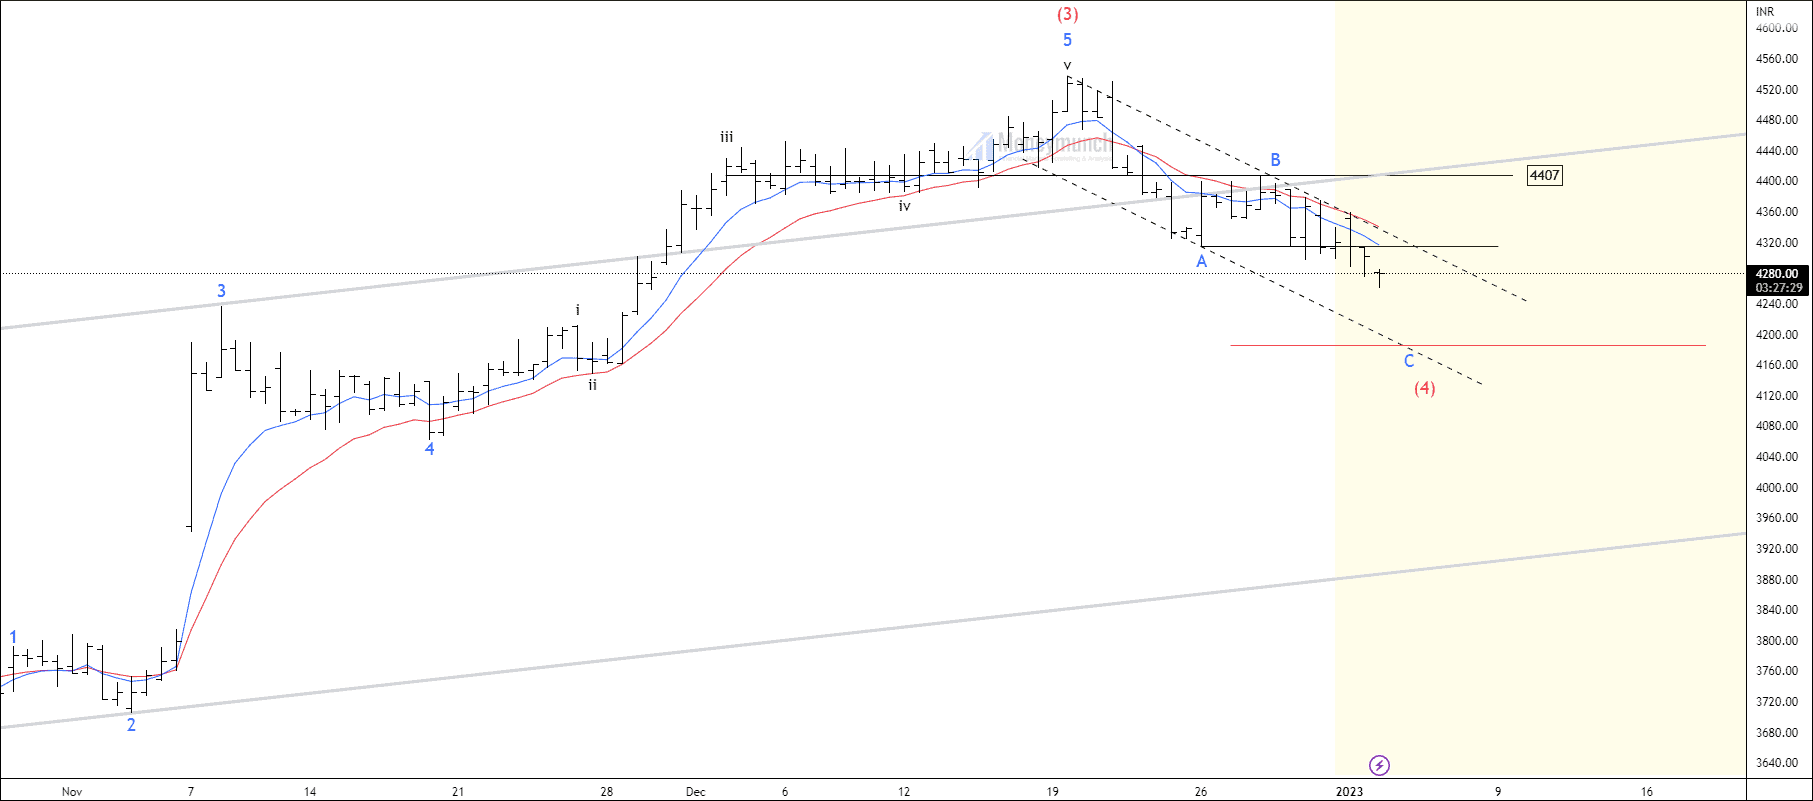
Timeframe: 4h
As per the chart, Britannia has accomplished the sub-wave B of wave (4) and started forming wave C.
If the price breaks down the low of wave c at 4314, Traders can sell for the following targets: 4266 – 4236 – 4214. A trade should only be initiated after a breakdown has occurred.
There are two price clusters where prices can reverse:
- Wave C can be accomplished at 0.382 Fibonacci retracements of wave 3 at 4214.65. Wave A=C at 4187. As shown in the chart, it forms a cluster range.
- Wave C can occur at 0.5 Fibonacci retracements of wave 3 at 4114. Additionally, a correction occurs near the previous wave.
Only subscribers can read the full article. Please login to read the entire article.
Get free important share market ideas on stocks & nifty tips chart setups, analysis for the upcoming session, and more by joining the below link: Stock Tips
Have you any questions/feedback about this article? Please leave your queries in the comment box for answers.
Disclaimer: The information provided on this website, including but not limited to stock, commodity, and forex trading tips, technical analysis, and research reports, is solely for educational and informational purposes. It should not be considered as financial advice or a recommendation to engage in any trading activity. Trading in stocks, commodities, and forex involves substantial risks, and you should carefully consider your financial situation and consult with a professional advisor before making any trading decisions. Moneymunch.com and its authors do not guarantee the accuracy, completeness, or reliability of the information provided, and shall not be held responsible for any losses or damages incurred as a result of using or relying on such information. Trading in the financial markets is subject to market risks, and past performance is not indicative of future results. By accessing and using this website, you acknowledge and agree to the terms of this disclaimer.