KAPAS, Guargum, and Turmeric: Market Trends and Insights

Guargum Prices Set to Soar: What You Need to Know
Free ncdex guargum chart calls

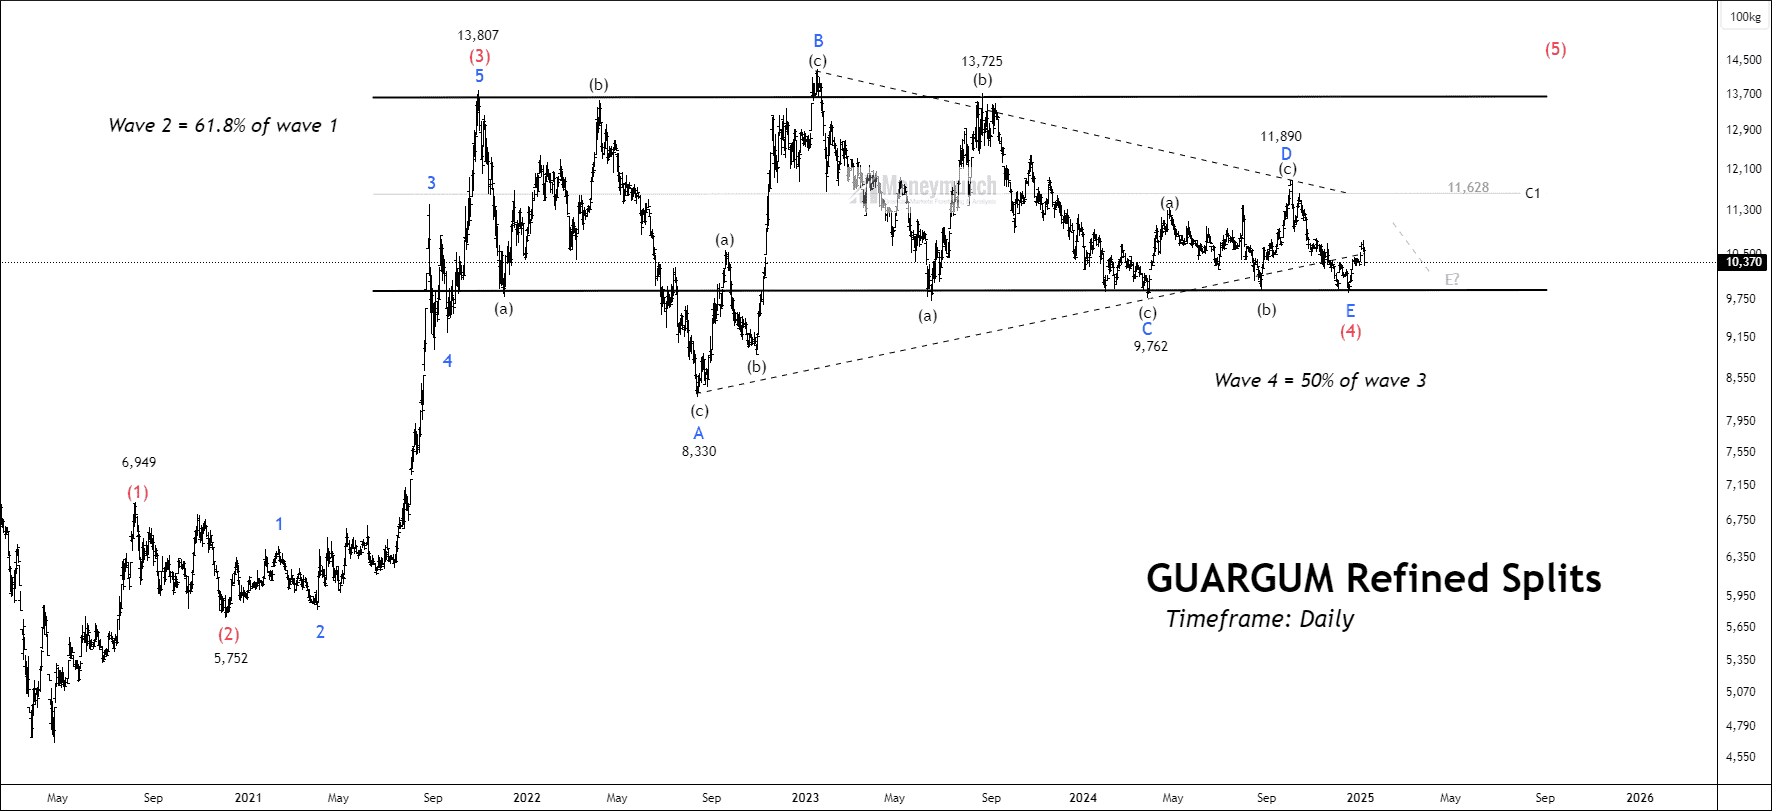
On the NCDEX, guar gum has formed an Elliott Wave cycle, with the final Wave E of Wave (4) approaching completion. A confirmation above Wave D could shift the entire outlook in favor of buyers. From a price action perspective, 9830 serves as a strong support level, while 13,650 acts as a supply zone, both of which have remained significant for over four years. Wave D represents a critical midpoint, ensuring a push toward the upper supply zone once the price sustains above this level or Wave D.

If the price has completed Wave (4) and has broken above Wave D, it is likely to reach the upper boundary of the value area, around 13,650. However, with the ADX (Average Directional Index) at 17, this suggests a weak trend, indicating that the current price movement lacks strength. If the price closes below the demand zone at 9,830, it could delay the expected bullish move. Traders should wait for confirmation before entering a long position to ensure a stronger trend.

We will update further information soon.

Turmeric Futures: A Bullish Trend or Market Correction Ahead
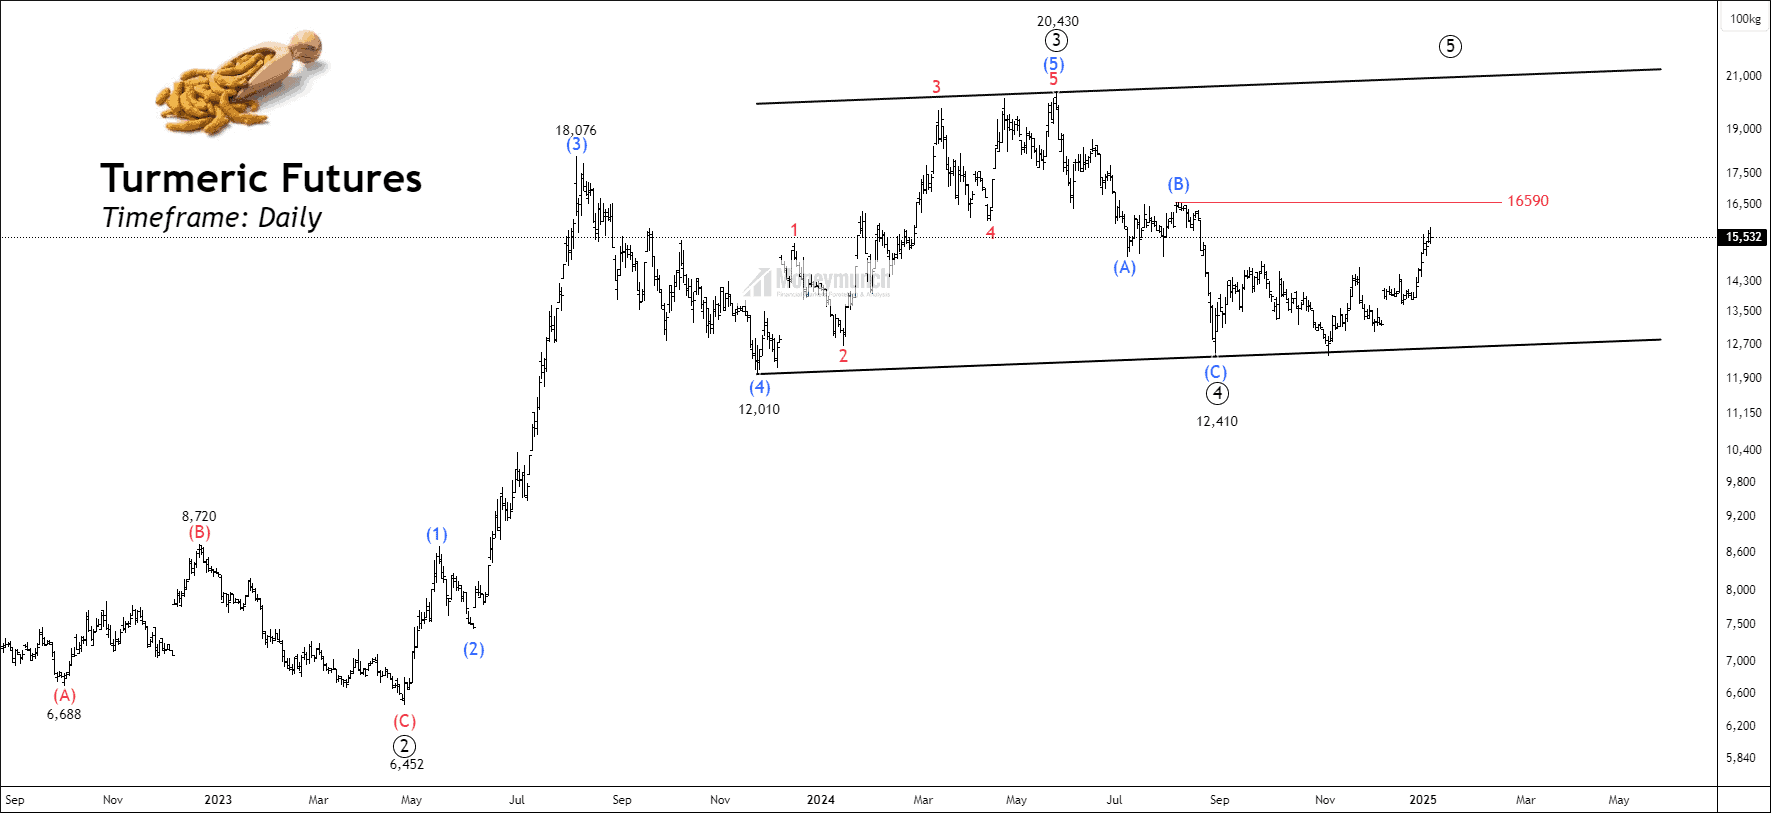
free NCDEX TMCFGRNZM chart callsContinue reading

MCX SILVER – Elliott Wave Setup

Get free MCX ideas, chart setups, and analysis for the upcoming session: Commodity Tips

Have you any questions/feedback about this article? Please leave your queries in the comment box for answers.

Disclaimer: The information provided on this website, including but not limited to stock, commodity, and forex trading tips, technical analysis, and research reports, is solely for educational and informational purposes. It should not be considered as financial advice or a recommendation to engage in any trading activity. Trading in stocks, commodities, and forex involves substantial risks, and you should carefully consider your financial situation and consult with a professional advisor before making any trading decisions. Moneymunch.com and its authors do not guarantee the accuracy, completeness, or reliability of the information provided, and shall not be held responsible for any losses or damages incurred as a result of using or relying on such information. Trading in the financial markets is subject to market risks, and past performance is not indicative of future results. By accessing and using this website, you acknowledge and agree to the terms of this disclaimer.

NSE Crude Oil: Imminent Upsurge or Unusual Reversal?

Have you remembered the wave analysis for MCX Crude Oil?
Visit here: NSE CRUDE OIL – Multiple Scenario Analysis

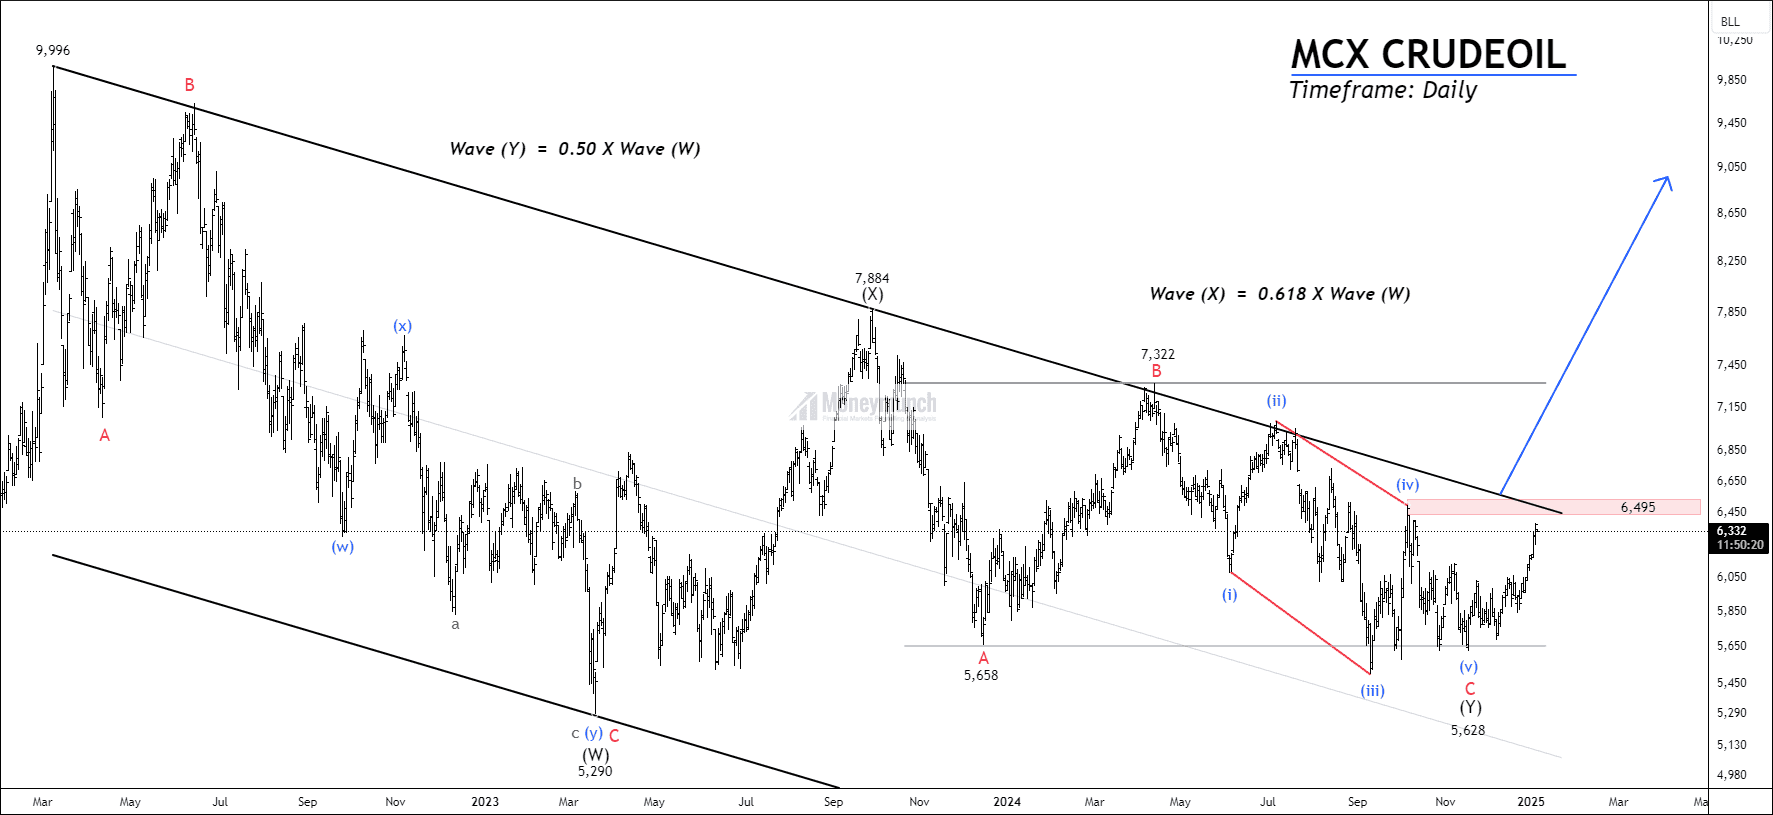
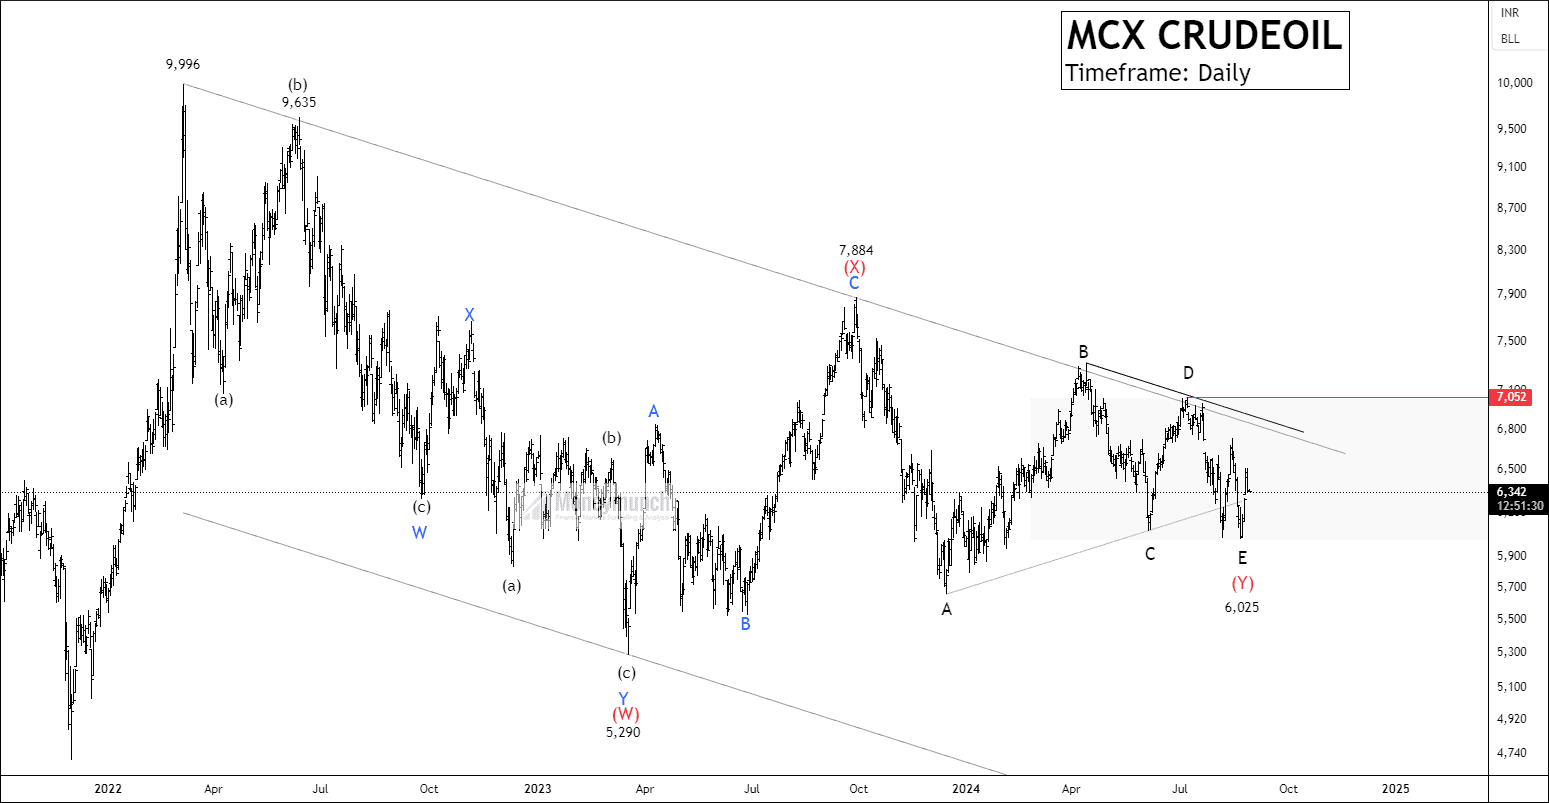
In our previous post, we explained that crude oil had formed a corrective pattern on the daily chart, labeled as (W) – (X) – (Y). Within wave (Y), a contracting triangle had formed. At that time, wave D had been completed, and wave E was just starting to develop. We also projected the entire wave E of wave (Y).

Free mcx crudeoil chart callsContinue reading