
Timeframe: Daily
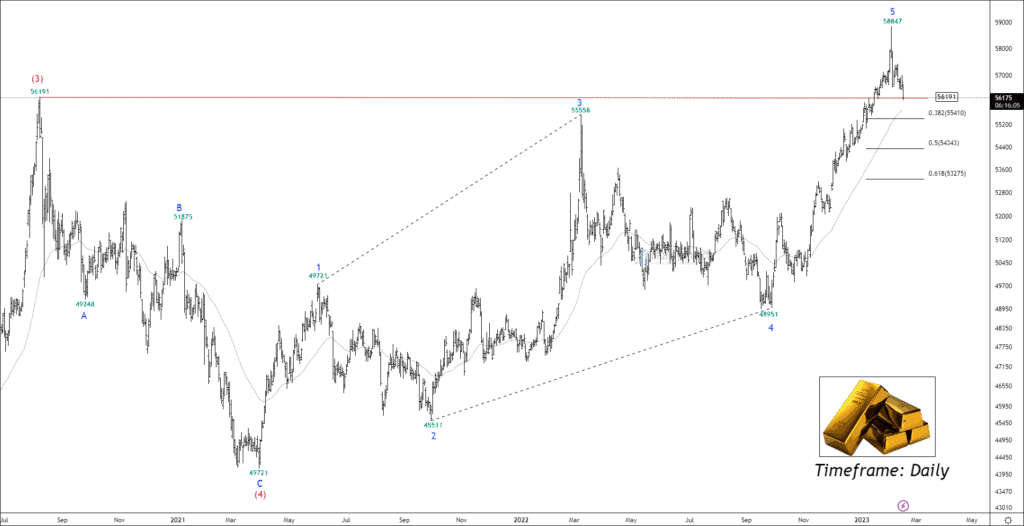
MCX gold has been forming impulsive waves (5) for more than 22 weeks. Price has accomplished corrective wave (4) at 49721 and formed the ending diagonal of wave (5).
As per the chart, gold made a new high of 58847, but selling pressure from the buyers pushed the price dramatically down. It ended up making a shooting star bearish candlestick pattern after narrowing its movement over the past two months. At this time, the price is trading near the high of wave (3) which is a crucial support level.
If the price breaks down low of wave (3), traders can sell for the following support: 55410 – 54343 – 53400. ATR of the price increased to 542, which signals that we can see good volatility after the breakdown of 56150.
Get free important share market ideas on stocks & nifty tips chart setups, analysis for the upcoming session, and more by joining the below link: Stock Tips
Have you any questions/feedback about this article? Please leave your queries in the comment box for answers.
Great analysis.
Please share your views on crude oil and silver.