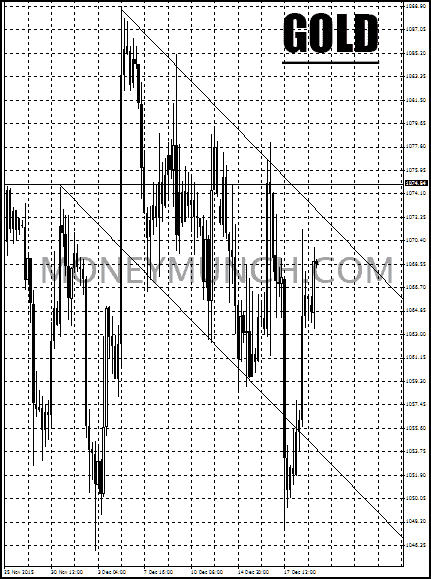
To become a subscriber, subscribe to our free newsletter services. Our service is free for all.

Access free trading tips and analysis on major forex pairs, cryptocurrencies, and Indian NSE currency tips. Stay informed and improve your forex trading skills with Moneymunch.

To become a subscriber, subscribe to our free newsletter services. Our service is free for all.

On above USD / CAD chart, you can see this pair is continuing falling since 17 Jan, but it had taken U-turn after hitting the support level (1.28355). I’d recommend buyers to stay in hold. On next week we may see 1.31300-1.33445 levels.
When should I sell USDCAD?
Level: 1.28175
Once USDCAD show closing below to above level or break that level, then you could sell it for 1.26030-1.23810.

Look at above chart, technically euro is looking weak against American dollar. Short term investors can start selling from Monday opening bell. It may show some up moves, but overall looking downward.
Targets: 1.13200-1.12100-1.11000
Keep note, if the EUR / USD will crossover resistance 1 then it may try to touch resistance 2 so be careful with it.
Long term target: 1.08600

USDJPY is planning to take U-turn from Monday opening bell. It could show 111.22 levels, but it’s a trap for day traders. This week we will see 113 levels.
If you would like to dive for long term then 113 levels is best for sellers because USDJPY is overall down for big time.
For long term investors: once the USDJPY will be close below the 111.100 levels then we see 110.08-108.350-105.600 levels.

As I wrote on above chart, if the crude oil closes below to 36.27 levels then day traders can very easily eat 35.6-35-34.41 levels.
Remember, 34.41 levels are very crucial and if it goes down to that level then we may see again the crude oil to 30 levels.
So now you must be thinking about what about up trend, right!? I will update further information soon.
To become a subscriber, subscribe to our free newsletter services. Our service is free for all.
Hourly technical chart is showing bearish signals, but wait. It’ll go more up from here and hit 1.00839-1.01918 levels. And then suddenly downtrend will being and fall upto 0.98527.
Remember, day traders for 1.00839 is hurdle. More information, I will update during market hours for forex subscribers.
Crucial level: 2.467
To become a subscriber, subscribe to our free newsletter services. Our service is free for all.

Hurdle: 356.96
Corn must not be close below the hurdle otherwise it will hit 353.9-350-347. If the corn stay above the hurdle for 1-2 consecutive days then we see 366-370 levels on next week.
Continue readingThese two levels will change your mind and help you to take correct decision! Level One: 1072.5 You can continue selling gold below this level. Targets: 1064-1060-1056
Level Two: 1075.9 Start buys gold without asking anyone! Targets: 1079-1082-1086
LIVE SELL SIGNALSell the EURUSD pair at 1.08755 for 1.08323-1.08062 levels. Login to see more details about EURUSD pair:

Indian Gold is going to open positive. Are you planning to buy / sell? Ah! Wait… You must be watch 1066.5 level. Yes, if it crosses over or stay above the that level for an hour then gold will show unstoppable up moves, but I’m thinking, in present time you must sell the gold for 1060-1058.5.

Best commodity for today. Clear sell signals! Hurdle: 904.5 level Targets: 899-897
Remember, if it will stay above an hour to hurdle, then it may cross over 907-911 levels.
To become a subscriber, subscribe to our free newsletter services. Our service is free for all.
Continue reading