In 2013, EURUSD Can Target 1.36 – 1.44

The pro-growth monetary policy should mildly support economies throughout the world in 2013, despite the persistence of different risk factors. The US dollar may decline further. What will happen to stocks and bonds?

US dollar: More declines ahead

The EURUSD played a starring role during the last part of 2012. This uptrend, which started in July after President Draghi declared the European Central Bank’s (ECB) willingness to buy unlimited bonds, is still ongoing. The market is meeting an important resistance at 1.33 and corrections are therefore possible. Uncertainty exists regarding Italy’s capability of forming a meaningful government after the political elections next year in February. However, the medium-term uptrend remains intact for the Euro against the US dollar. The ECB should not cut rates short-term, as the economy, though weak, is improving. The latest Purchasing Manager’s Index (PMIsurvey signaled that productivity has bottomed out and should start to rise over the medium-term. The ECB’s “wait and see” approach can support the Euro to reach higher levels. Since 1977, bull-moves within long-term bull cycles have lasted between 20% and 30%, top to bottom, before fading away. Consequently, an increase above 1.3350 can raise the price of the euro to 1.36, and eventually to 1.44.

Although Japan is in recession, Japanese housing starts, industrial production, and consumer sentiment have recently been positive. Prime Minister Abe has become more accommodative in his tone toward the economy. The Japanese yen could experience less pressure in the months ahead. Currently, USDJPY is experiencing a runaway bull-trend and is meeting good resistance at 84.55. It corresponds to two long-term trendlines and should hold at first touch. The US dollar is in fact extremely overbought and could correct to 83.00. According to the latest Commitment of Traders (COT) report, futures funds have bought massive amounts of the US dollar; a move above 85.10 will shift the price to 86.20/87.00

Will bond prices fall and stock prices rise?

The debate in Congress over the “fiscal cliff” is ongoing. A compromise could be found by the first part of 2013. As risk continues to fade, the US treasury yields should move toward 2.00%. The Federal Reserve is willing to let inflation expand in order to create positive momentum in the job market. Technically, the US ten-year note prices are leaning against the upper channel line of the past 26 years. A tentative breakout occurred in July and has apparently failed. In fact, the market is extremely overbought. According to the latest COT report, future funds have accumulated about 400,000 contracts of the ten-year treasury notes, the highest level in the past four years. What is left to buy if most of the major players are already in the market? In 2013, the prices of the ten-year notes futures could decline for 3-6 months and reach 132-130.

With bond yields rising and the dollar declining, US stocks should appreciate in the first part of 2013 as well. US company earnings are still performing well, while profit margins should improve with the labor market only mildly growing. The Fed’s pro-growth approach is supporting prices, and once Operation Twist concludes, it will be followed by net bond buying. Technically, the S&P 500 index is challenging the higher Bollinger bands at 1450. A swing above 1475 could lift prices to 1500/1550. Historically, January is a good month for stocks. Volatility could increase, however, if a compromise is not found in the short-term. During the last part of 2012, US companies and households have already reduced spending. The business sector can increase production only if foreign demand rises faster in 2013 than in 2012. The latest data has shown that China’s economy is growing again, but other so called “emerging markets” are still underperforming. A recession in the US will destabilize the world’s still fragile economic recovery.
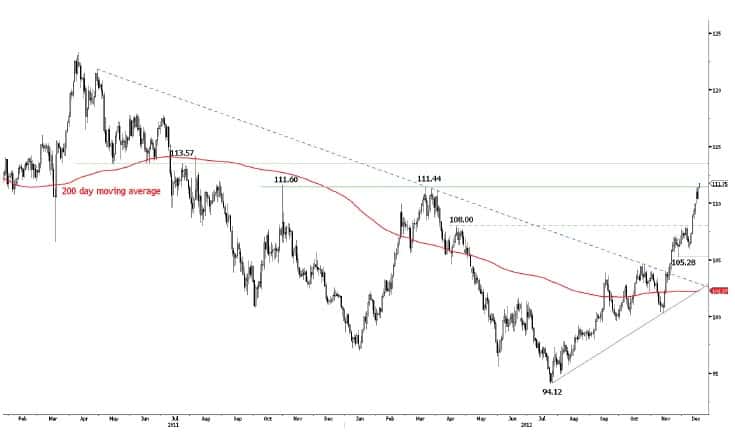
EURJPY Chart Pattern Analysis (Forex)

EUR JPY

Challenging the strong resistance at
111.44/111.60.
• EUR/JPY’s rise is overextended but, yesterday,
it managed to make new highs. It is now
challenging the strong resistance at
111.44/111.60. Given the general overbought
conditions, we favour a phase of weakness in the
next few days.
• EUR/JPY has moved above its long-term
downtrend (linking the October 2009 top with
the April 2011 top). Monitor the test of the key
resistance at 111.60 (31/10/2011 high).

Short 3 at 111.30, Objs: 110.35/108.10/106.10, Stop: 112.25

Continue reading

EUR/USD(Bouncing on support at 1.2875) updated 11-12-2012

eur-usd-intraday

Await fresh signal.

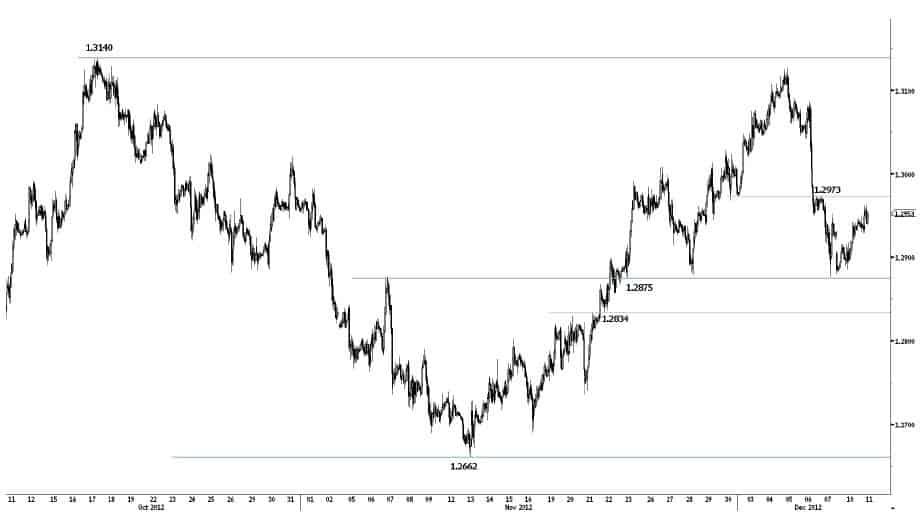
Bouncing on support at 1.2875.
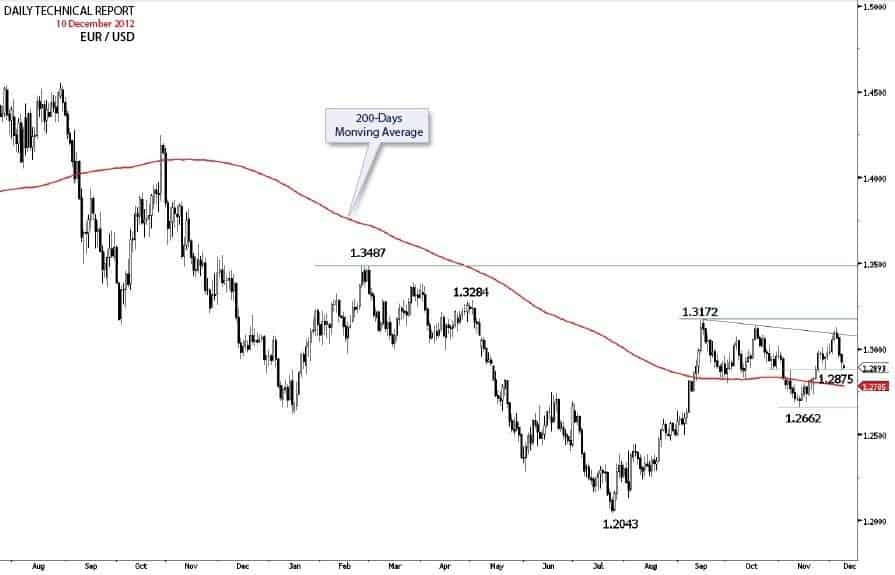
• EUR/USD has successfully tested the key
support at 1.2875. Resistances for a bounce are
given by 1.2973 (07/12/2012 high) and 1.3046
(04/12/2012 low).
• The underlying trend is negative (see the
succession of lower highs since May 2011 peak).
Therefore we expect limited upside potential
given the strong resistance at 1.3172 (17/09/2012
high) and the overall overbought conditions.

Continue reading

S&P Following Up of the Short Term

This is just a brief follow up since tomorrow morning I will be busy and today’s inconclusive price action with another small range body (Spinning Top) does not add anything new to the short-term potential scenarios I have discussed in the weekly technical update.

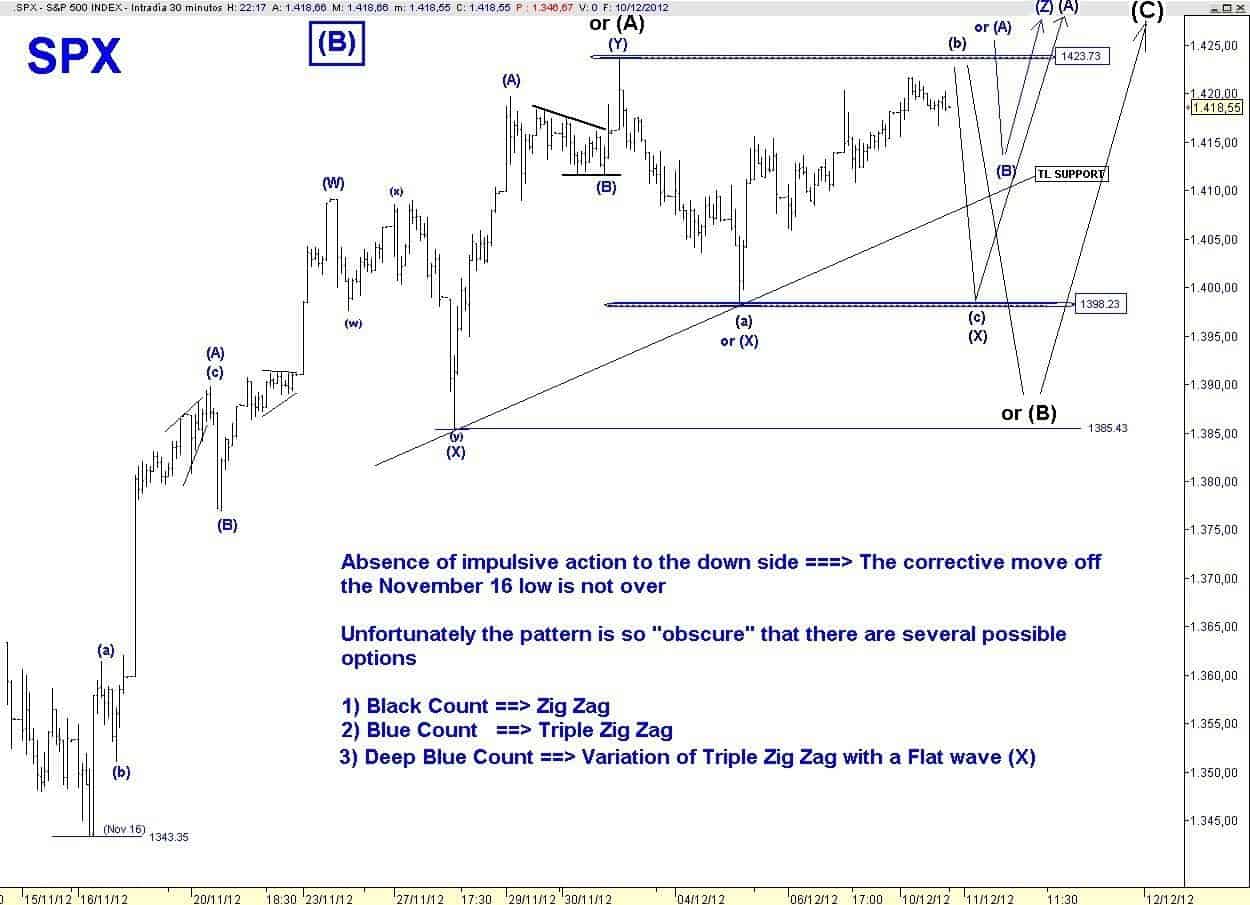
For the immediate time frame price remains range bound between the immediate support at 1398.23 and the immediate resistance at 1423.73.

Theoretically, despite being close to a potential break out the daily Spinning Top is suggesting weakening of upside momentum, but it is unlikely to expect a meaningful pullback ahead of the FOMC.

It seems that the market remains, so far, careless to Risk off news from Europe and a potential, at least, short-term reversal of the EUR, the approaching FOMC meeting may be the reason behind this benevolent attitude.

Therefore, at the moment there is no clear edge within the potential EWP options that I showed this Sunday.

Also, it is strange that at today’s EOD we have VIX up Equity up and bonds up.

Below in the 30 min SPX I show the same ideas:

sp-short-term-bullish

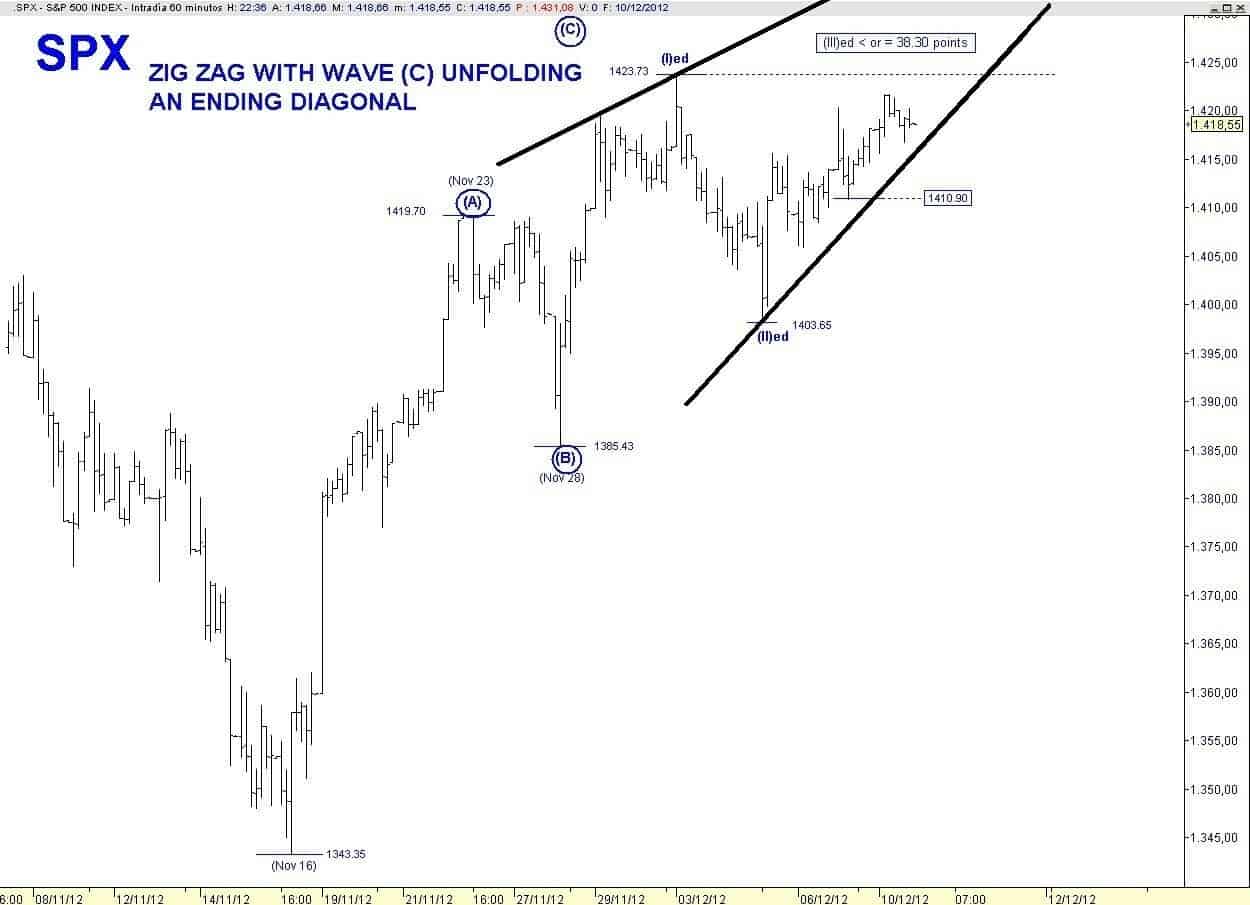
Additionally, the scenario of a ZigZag with a wave (C) unfolding an Ending Diagonal is still possible as long as 1410.90 is not breached.

If this ED pattern plays out it could have a bearish outcome by ending the assumed wave (B) off the September 14 high since we would most likely have negative divergences in the final wave (V) of the ED.

sp-short-term-bearish

Conclusion:

Regardless of a potential pullback I maintain a bullish bias (until technical evidence shifts to the bears camp) since the pattern off the November lows is not complete yet.

Continue reading

EURUSD (Await fresh signal)

eur-usd

Testing support at 1.2875.

• EUR/USD has weakened after failing to break
the resistance at 1.3140 (17/10/2012 high).
Monitor the test of the key support at 1.2875. An
hourly resistance is at 1.2973 (07/12/2012 high).
Another support can be found at 1.2834
(intraday low).

• The underlying trend is negative (see the
succession of lower highs since May 2011 peak).
Therefore we expect limited upside potential
given the strong resistance at 1.3172 (17/09/2012
high) and the overall overbought conditions.

Continue reading

Global Market: Short Term View

SPX Long Term

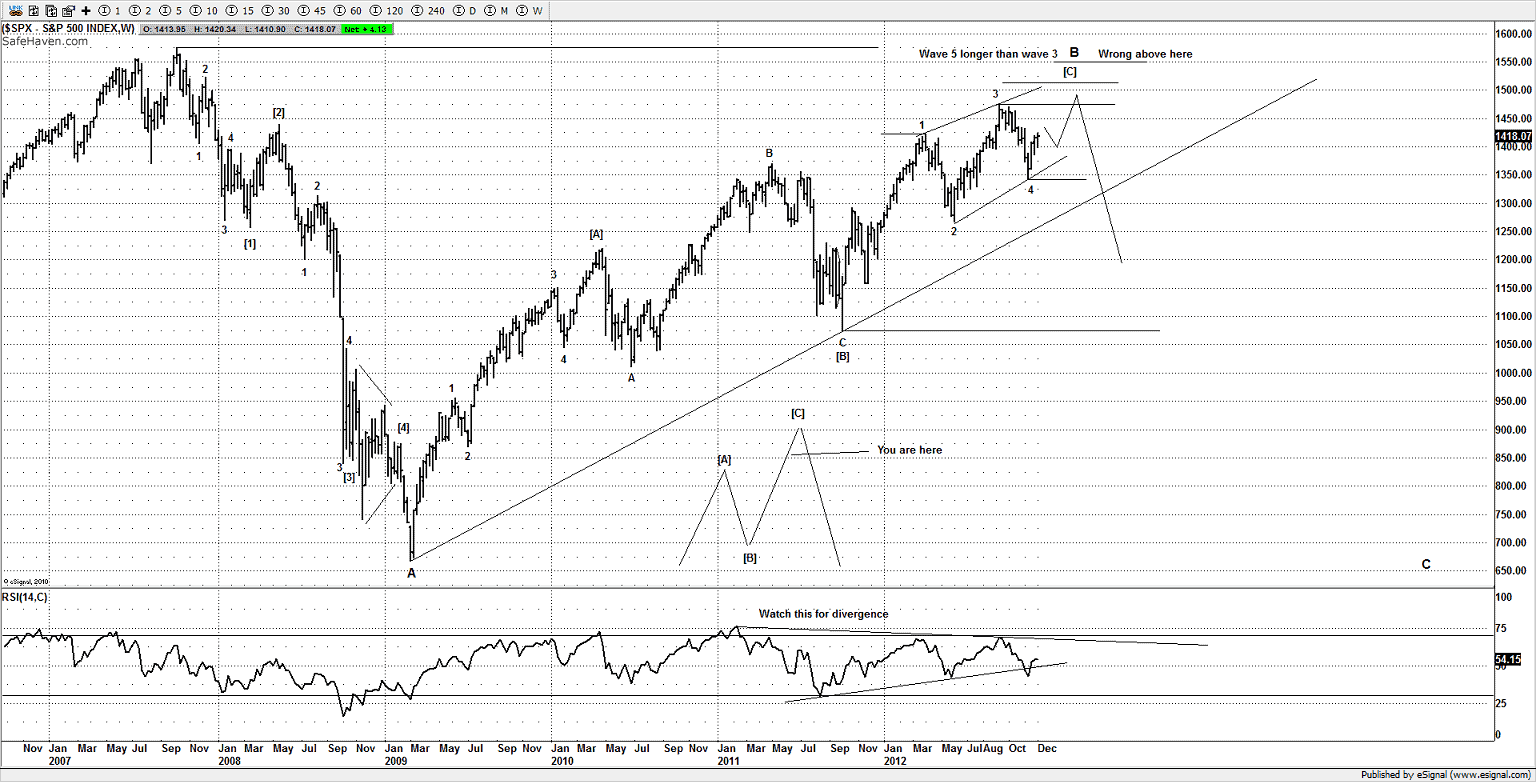
My preferred wave count is similar to the idea I posted some weeks back on the DAX and that I suspect the SPX is inside a 5th wave for an ending diagonal so likely to chop higher into Jan-Feb period next year before a meaningful high. It would need a seriously strong break below the 200DMA on the SPX before I would switch to an alternative bearish idea, whilst this market continues higher I still prefer the bullish option over the bearish option.

Although I am certainly no perma bull and calling for SPX 2000 or anything like that, recent price action over the last few days suggests the market is simply correcting the advance from the Nov 2012 lows and likely to push higher once the correction has finished.

shor-term-sp-500

When you look at other US markets we can clearly see the same sort of shape, especially markets such as the NYSE. The last decline from the September 2012 highs was a 3 wave decline as we can clearly see the NYSE is pushing higher as I suspect it would, but is lacking the new high it needs to complete its idea.

More Information Click Here

Continue reading