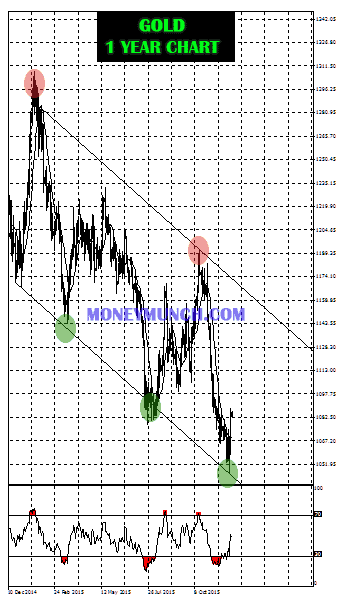
Indian Gold is going to open positive. Are you planning to buy / sell? Ah! Wait… You must be watch 1066.5 level. Yes, if it crosses over or stay above the that level for an hour then gold will show unstoppable up moves, but I’m thinking, in present time you must sell the gold for 1060-1058.5.
 Unlock This Article
Only subscribers can read the full article. Please login to read the entire article.

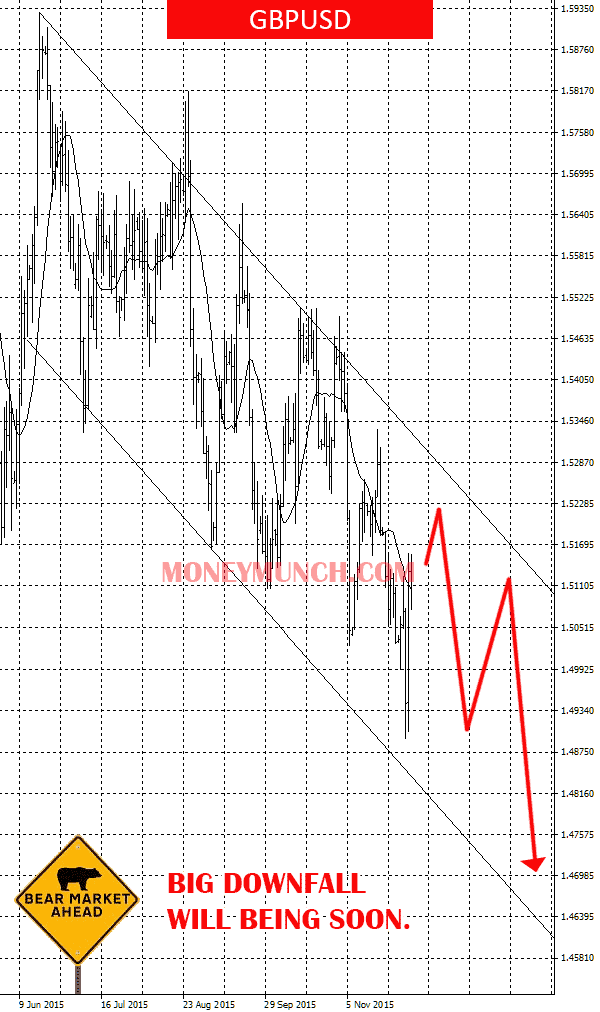
Best commodity for today. Clear sell signals! Hurdle: 904.5 level Targets: 899-897
Remember, if it will stay above an hour to hurdle, then it may cross over 907-911 levels.
To become a subscriber, subscribe to our free newsletter services. Our service is free for all.
Continue reading