Flag Trendline SP500 Update

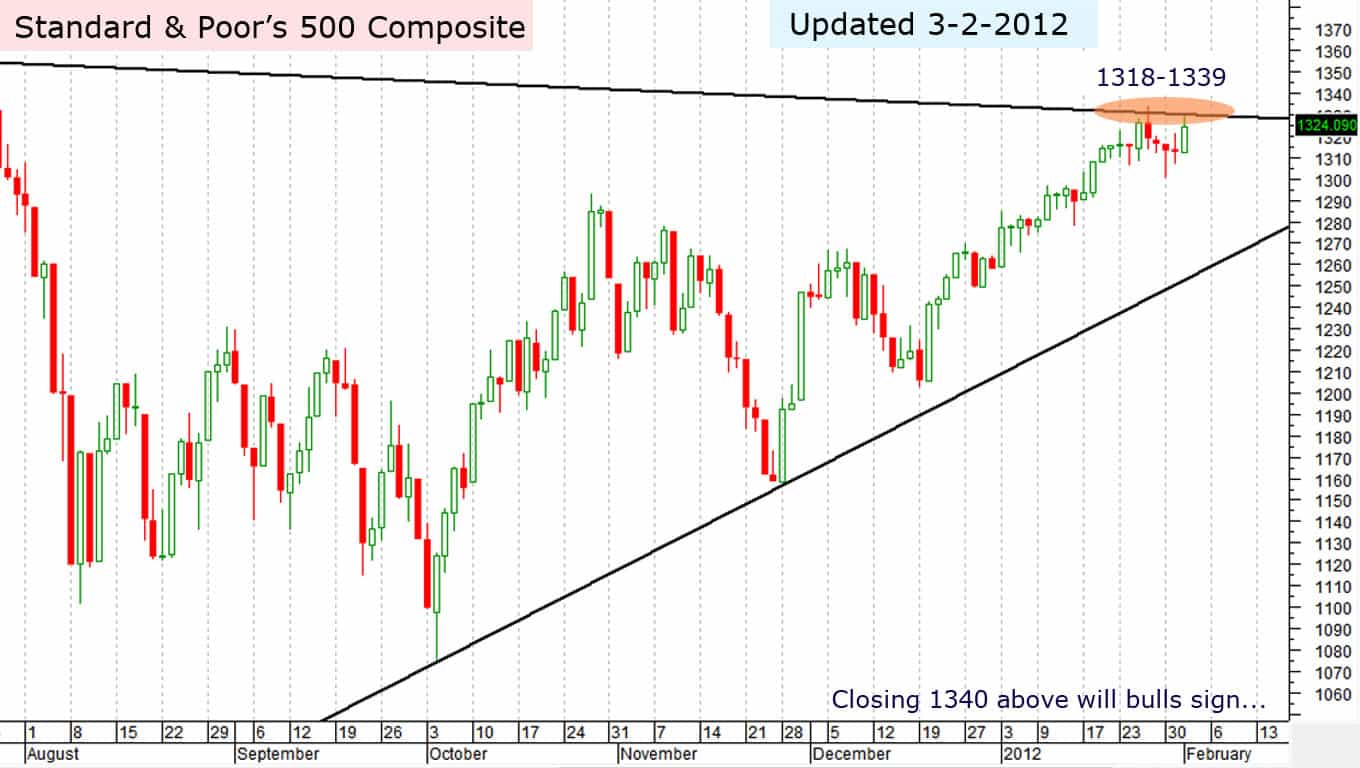
We’re hearing much talk about the potential Bear Flag pattern on the S&P 500 Daily Chart.

Let’s take a mid-week update on the pattern and note the current key price boundary levels to watch for clues.

First, here’s the S&P 500 Daily Chart trend-lines structure:

SP-500-Daily-Chart

Moving from right to left, we see the current “Bear Flag” consolidation pattern stretching from early June to present.

The lower rising trendline resides near 1,340 while the upper rising trendline continues near 1,390.  The 30-min chart below emphasizes these trendline levels.

Now, moving to the left of the chart, the last time we saw a similar Daily Chart ‘flag’ struture was from August to October 2011.

While price did break the downside trendline, the full downside target was NOT achieved due to a power-rally which developed off the 1,100 Index level.

From there, price structure continued to trade mostly in a “Creeper” uptrend, bound by the prior “flag” trendlines until the breakdown of May 2012.

To become a subscriber, subscribe to our free newsletter services. Our service is free for all.

Continue reading

Shanghai Composite reached to Support

Shanghai-Composite

The Chinese government reported imports rose just 6.3 percent last month from a year earlier, less than half the 12.7 percent expected increase. No doubt this reflects softening domestic demand in the world’s second largest economy and one reason why commodities have been selling off.

Don’t you think the government has to be cooking up something big?

To become a subscriber, subscribe to our free newsletter services. Our service is free for all.

Continue reading

Weekly Market Structure in S&P 500

S&P 500

Note the weekly bear flag on the S&P 500 index. You may call it by a number of different names (wedge, pullback, anti, flag, etc.), but the concept is the same: A period of contracting volatility with an upward bias following a sharp selloff. This pattern could be expected to resolve downward, providing a headwind for bearish trades over the next several weeks. Be aware that weekly patterns can take a long time to play out, and there is plenty of room for upswings on daily and intraday timeframes even if this weekly pattern resolves cleanly. Knowledge of higher-timeframe technical patterns often provides good context for trades on lower timeframes. This is an important part of understanding evolving market structure and potential technical risk factors.

To become a subscriber, subscribe to our free newsletter services. Our service is free for all.

Continue reading

Dow Jones (Weekly Update 22-06-2012)

Stocks ended a volatile week on a strong note, with all three major indexes finishing sharply higher in trading today. Stocks bounced back after Thursday’s huge sell-off.

The DJIA ended the day 0.53% higher at 12,640.78, the S&P 500 ended the day 0.72% higher at 1,335.02, and the Nasdaq ended the day 1.17% higher at 2,892.52.

The week began on a promising note as Greek voters opted for the pro-bailout parties in the election last Sunday. Although the Greek election results ended a great deal of uncertainty, Spanish borrowing costs rose to a euro-era high. Italian borrowing costs also surged raising renewed worries over the euro zone debt crisis.

Investors’ sentiment was also weighed down by lack of action from the Federal Reserve at the end of its two-day monetary policy meeting on Wednesday. The Fed extended its Operation Twist program on Wednesday, which was expected. However, the central bank did not hint at more aggressive monetary easing.

Worries over the euro zone, lack of action from the Fed, and some concerns over global economic growth sparked a huge sell-off on Thursday.

Although stocks made a recovery today, the Dow Jones and S&P 500 ended lower for the week. The Dow Jones fell 0.99%, while the S&P 500 fell 0.58% for the week. Nasdaq managed to post a 0.68% gain for the week.

Financials led the gains in trading today, gaining 1%. The gains in the sector were led by bank stocks, which rose despite a rating downgrade of five of the six biggest U.S. banks by Moody’s. The ratings agency also downgraded the credit rating of several European banks.

To become a subscriber, subscribe to our free newsletter services. Our service is free for all.

Continue reading

Euro Crisis Will Never End in 1 Chart

Is this how the euro crisis ends? Not with a bang, but a “firebreak”?

What’s a firebreak? And how is it different from a firewall? And what distinguishes that from a financial bazooka? These are semantic, if not existential, questions that markets have little use for. Whatever you want to call it, the meaning is clear: throwing money, and lots of it, at Europe’s problems.

It’s been enough to send Spanish borrowing costs tumbling the past few days. On Monday, the yield on Spanish 2-year bonds was 5.5 percent; on Thursday it was 4.6 percent. Is the euro saved?

Haha, no. Of course not.

We’ve seen this movie before. Every few months, Eurocrats hint at SOMETHING BIG. And every few months, it turns out to not be something big. Here’s the anatomy of a euro salvation rumor. It starts with a top official saying that the euro bailout funds — the EFSF and ESM — might buy bonds from troubled countries on the open market to push down borrowing costs. That’s fine. But it’s not “new”. It’s the definition of what those bailout funds can do.

But here’s the catch. The ESM doesn’t even exist. Not yet, at least. It still needs to be ratified. And that will take a bit longer than expected. But there’s an even bigger catch. There isn’t enough money in the actual bailout fund, nor will there be in the hypothetical one. Suppose the EFSF buys some bonds. That will push down yields for awhile. But what happens when the money starts to run out? Yields will go back up. A firebreak/firewall/bazooka needs unlimited funds to work.

In other words, it needs to be the ECB. They have infinite money. That’s the magic of the printing press.

And that’s the final part of every euro rumor. It involves the EFSF getting a banking license so the ECB can give it money. Of course, the ECB doesn’t want to do that. That’s when the rumor dies.

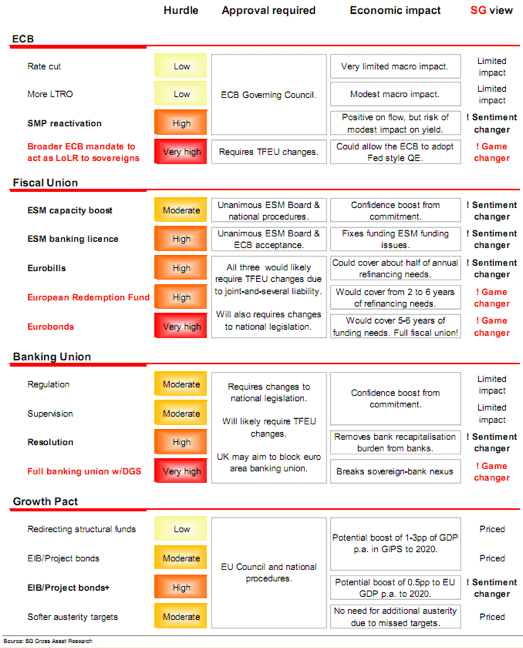
This chart from Societé Generale, via Simon Hinrichsen of FT Alphaville, lists the things Europe could do, how big a hurdle there is to them happening, and how much they’d help. To paraphrase Ezra Klein, everything that would help a lot is politically impossible and everything that’s politically possible wouldn’t help a lot. Hence, the neverending crisis.
euro-crisis

There’s another takeaway here. Europe’s currency union needs a fiscal union and a banking union if it’s going to work, in the long run. But Europe needs the ECB to get it to that long run. Spain and Italy won’t stay solvent anywhere near the years it will take Europe to make the tough political decisions on fiscal and banking unions. The ECB needs to bridge that gap.

That’s the scariest part about the euro crisis. There are very few scenarios where the euro survives that don’t involve the ECB doing much, much more. Their track record doesn’t exactly inspire confidence.

In the mean time, did you hear that the EFSF might buy some bonds?
Continue reading

Dow Jones Compated to Nifty Future

dow-jones-denifition

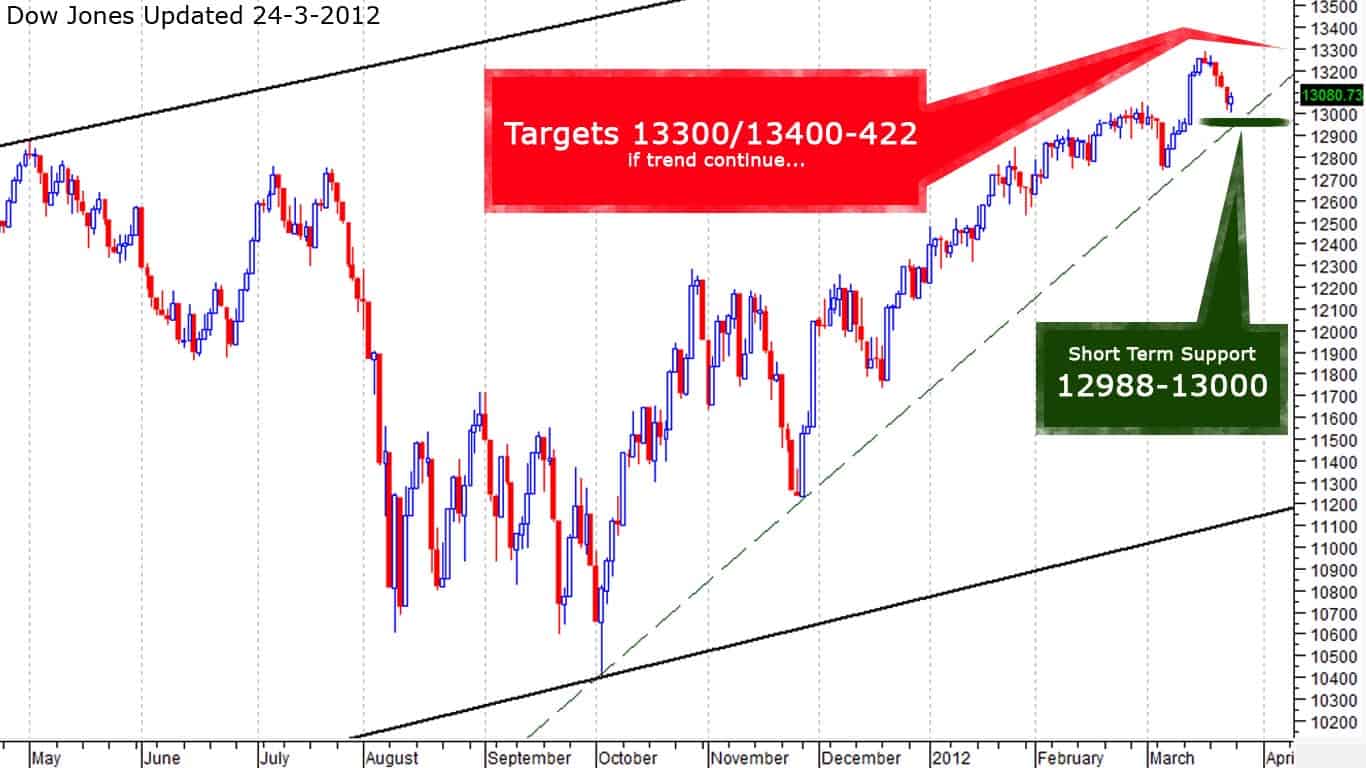
Dow Jones, Just Watch above Chart

Support: 12992 level around

Suppose to not breaking or close below it… then Dow Jones will test 13300 and 13400-422 very soon

In case, Dow Jones will breach to 12988-13000, then buyer will enter with heavy quantities but keep in mind… ”It should not good if close below it”.

Compared to Indian Nifty:

Buyer will act 5240-5258 and they intend will be 5348-5356 and also 5412-5448 above

In-case, Nifty close below 5240… then Targets 5176 and 5089

To become a subscriber, subscribe to our free newsletter services. Our service is free for all.

Continue reading