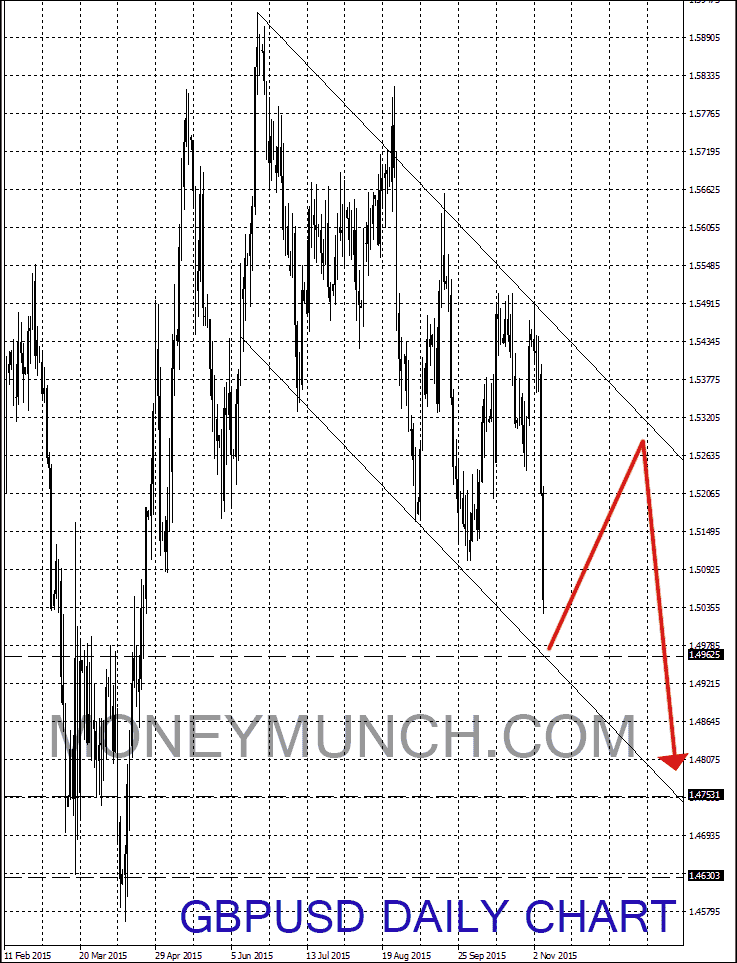
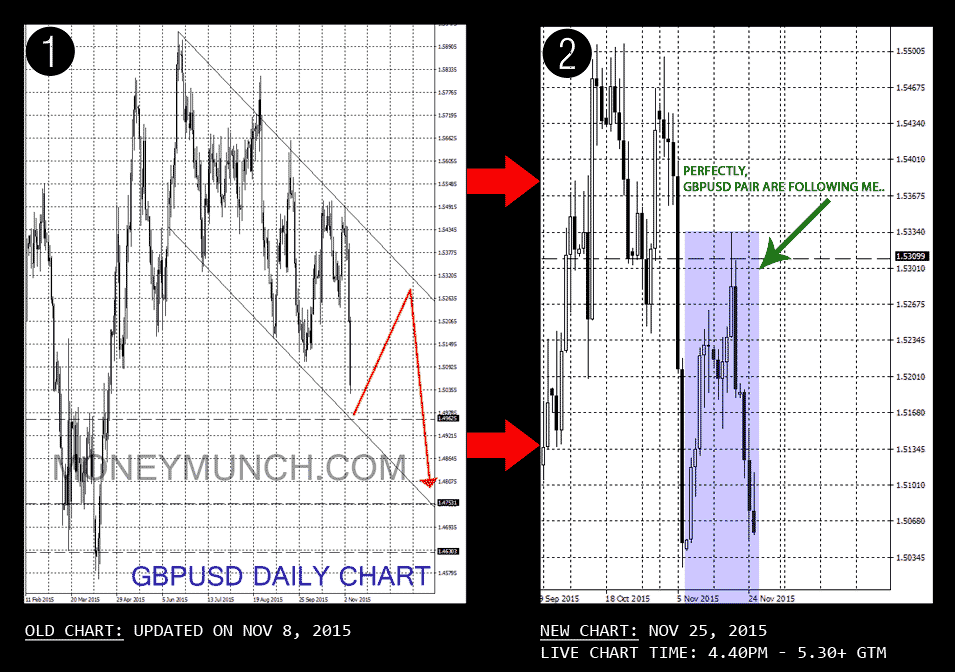
Look at the above chart, GBPUSD pair may fall Monday up to 1.4985 levels and after hitting the 1.4985 level it’ll try to move up and touch 1.50925-1.52065+ levels. Day traders should to keep in mind 1.49625 level. If GBPUSD pair breaks the 1.49625 level, then we will see 1.48075-1.47531-1.46303 below levels.
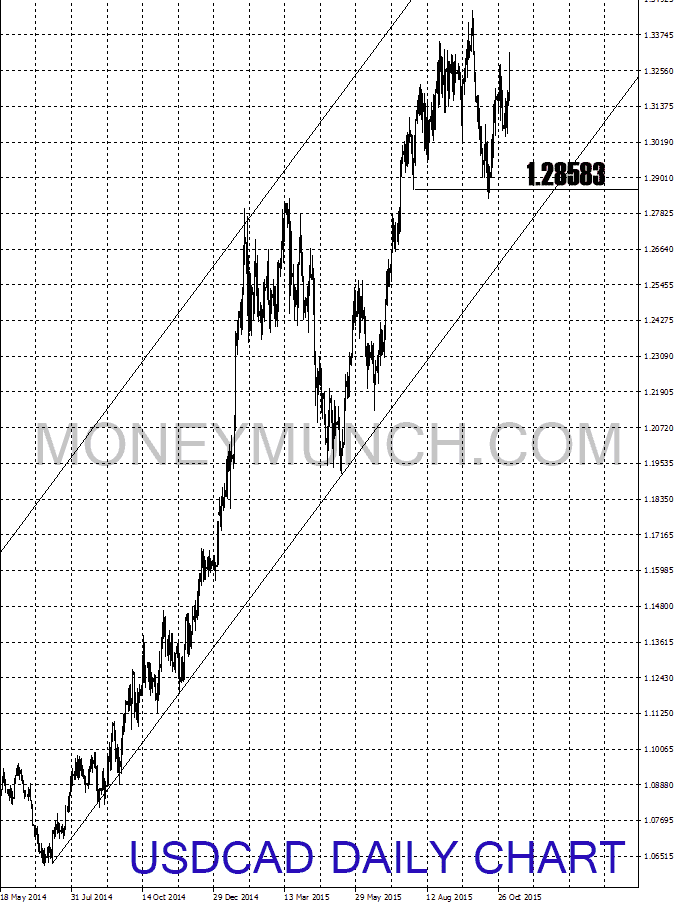
USDCAD is strongly bullish for long term. If that close below to 1.27217 levels then downtrend will be being.
If USDCAD pair crosses and close above the 1.33478 levels then buy signal will be arisen with high volume, and later it’ll show us 1.34172-1.35000-1.35580+ levels.
On the above chart, I’ve mentioned 1.28583 levels. Short term buyers may see it shortly, so be careful before investing in this pair.
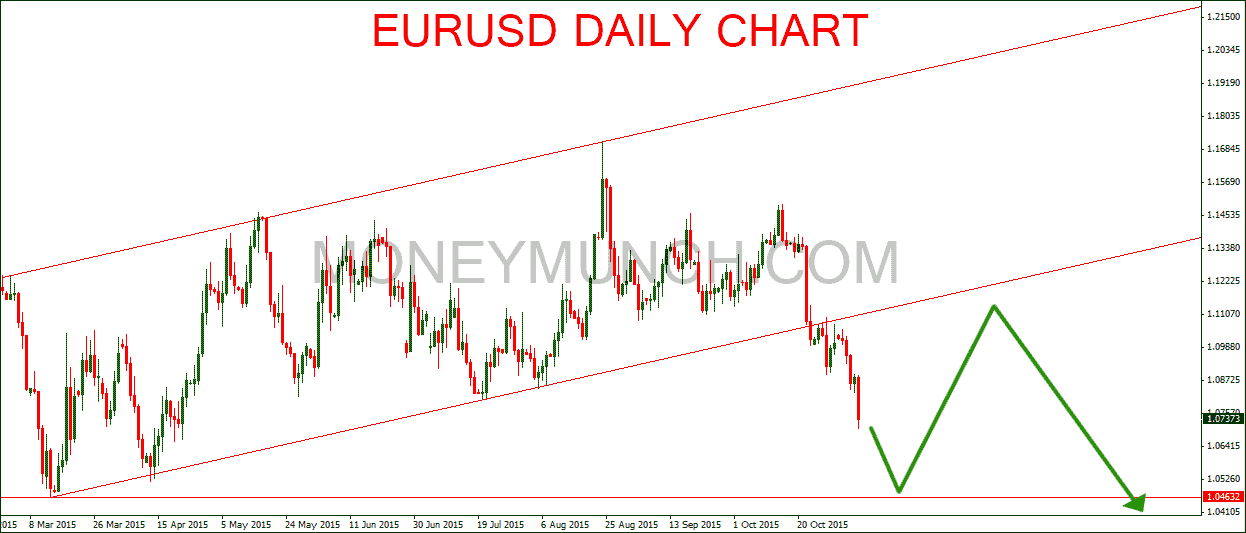
If the EURUSD pair breaks and closes below to 1.07167 levels then it will hit 1.05906-1.04676 levels OR if it not breaks that level then it’ll stay up for some time!
Continue reading

 Unlock This Article