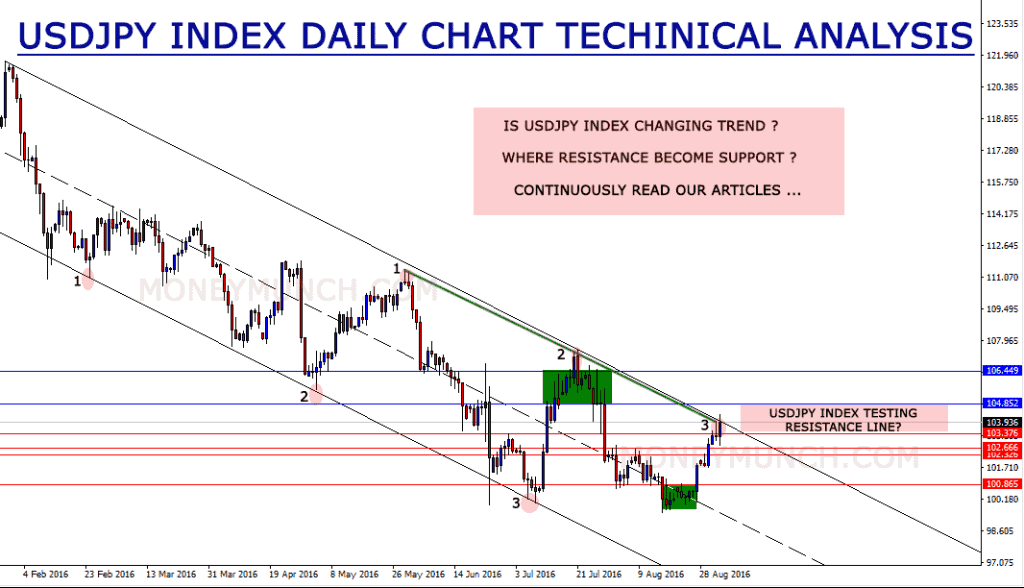
USDJPY index daily chart is indicating downtrend. You will see 103.376 – 102.666 ffffff– 102.326 levels soon.
104.599 level is resistance level for free subscribers.
Is USDJPY INDEX changing trend?
Where resistance become support ?
UPDATE : USDJPY index and GBPUSD index

Do you forget what I wrote about USDJPY index? Click here for it.
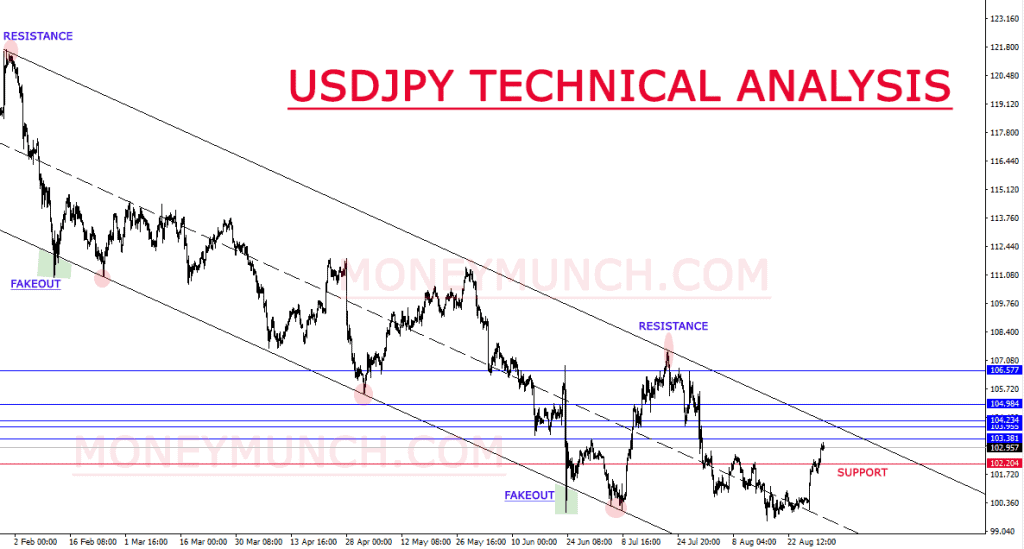
I had clearly written,” You will see USDJPY 103.381-103.995 levels soon.”
USDJPY index hits Both targets 103.381 – 103.995 levels

Before market open what had I said about GBPUSD index?
Do you forget ? Just click here…
Buying opportunity will generate for GBPUSD index traders.
You may buy in the opening session, GBPUSD index will hit 1.31739 – 1.32104 – 1.32321 levels soon!
All Targets have been achieved 1.31739 – 1.32104 – 1.32321 levels.
To become a subscriber, subscribe to our free newsletter services. Our service is free for all.
UPDATE : ONE BY ONE TARGETS ARE ACHIEVING USDJPY INDEX
Do you forget my previous USDJPY index article? Click here for read
I had written about USDJPY index yesterday 12:20 PM (5:30+ GMT)
“You will see USDJPY 103.381-103.995 levels soon.”
First target has been achieved.
Is USDJPY index hit my second target?
To become a subscriber, subscribe to our free newsletter services. Our service is free for all.
UPDATE : EURUSD index

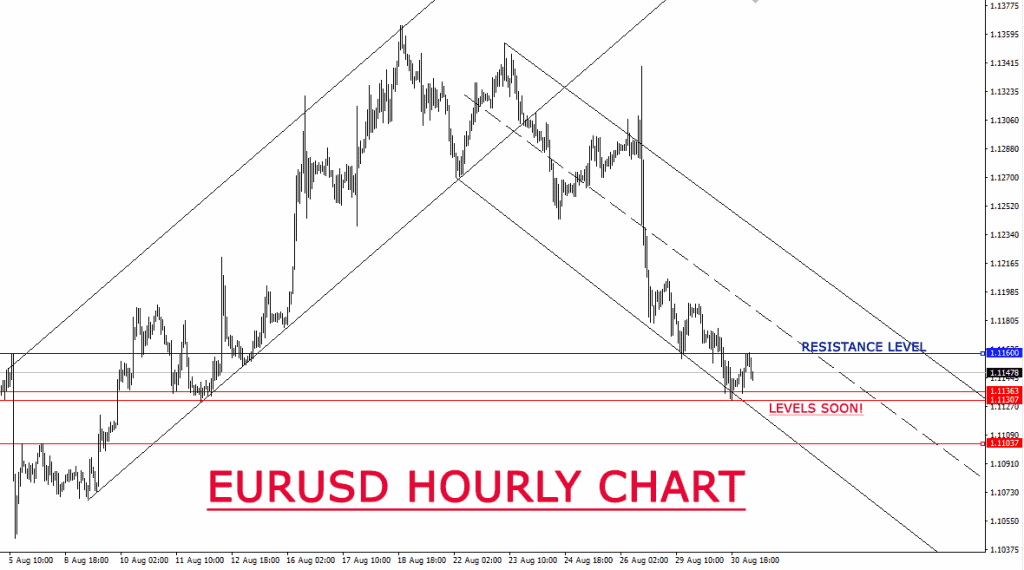
What had I said about EURUSD index few minutes ago
“EURUSD index indicating bearish signals, you will see 1.11363-1.11307-1.11038 levels soon!”
To become a subscriber, subscribe to our free newsletter services. Our service is free for all.
FREE FOREX TIPS: EURUSD and USDJPY Indexs
SHORTCALL : USDCHF INDEX
To become a subscriber, subscribe to our free newsletter services. Our service is free for all.

Unlock This Article