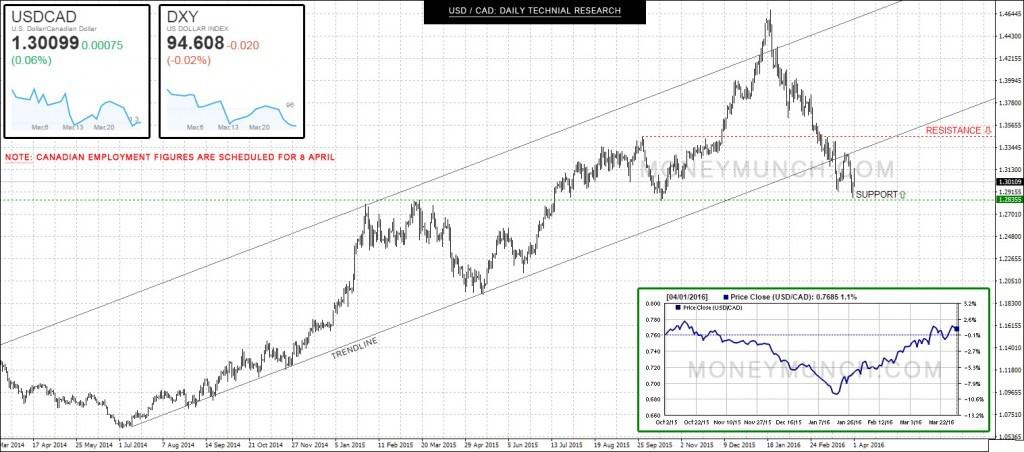
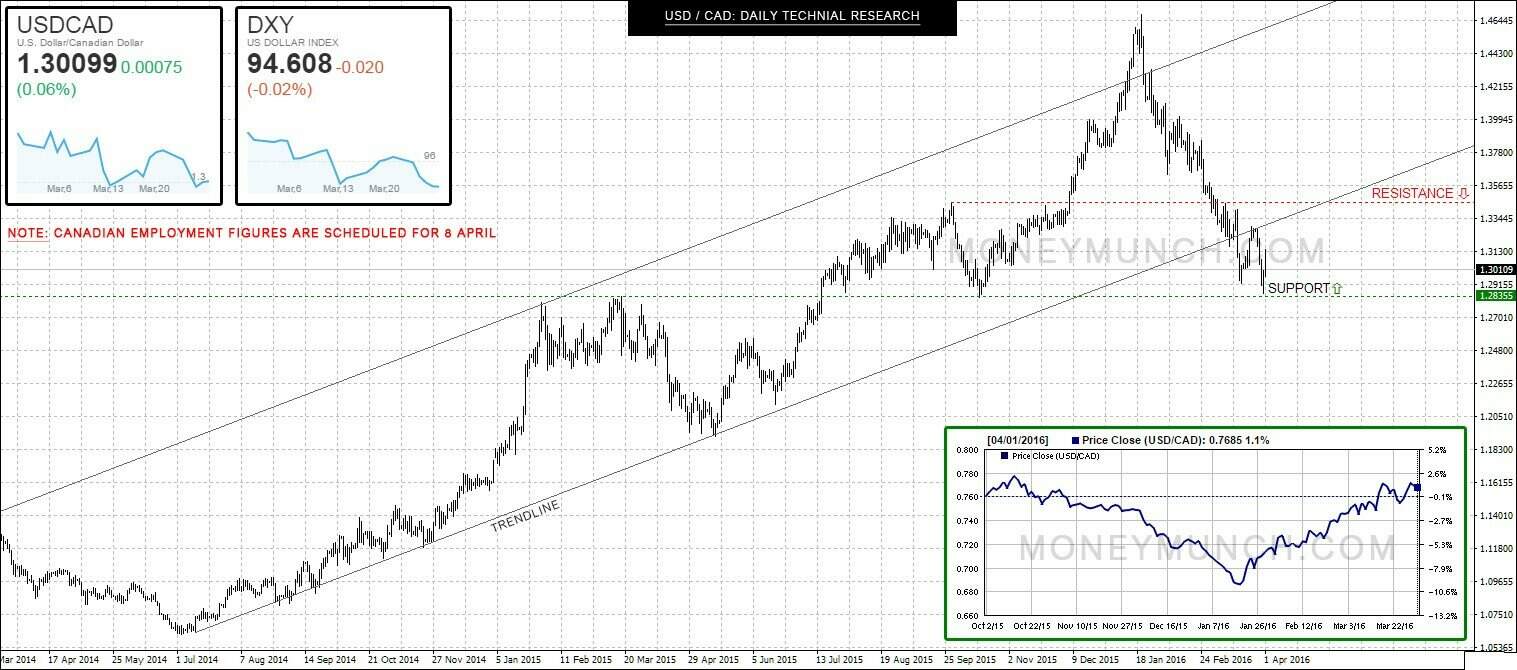
On above USD / CAD chart, you can see this pair is continuing falling since 17 Jan, but it had taken U-turn after hitting the support level (1.28355). I’d recommend buyers to stay in hold. On next week we may see 1.31300-1.33445 levels.
When should I sell USDCAD?
Level: 1.28175
Once USDCAD show closing below to above level or break that level, then you could sell it for 1.26030-1.23810.

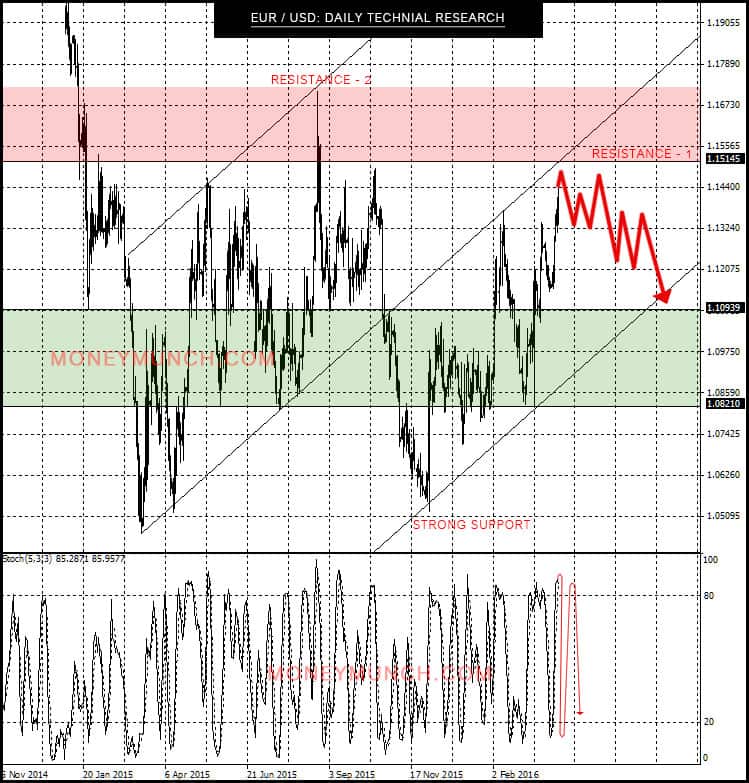
Look at above chart, technically euro is looking weak against American dollar. Short term investors can start selling from Monday opening bell. It may show some up moves, but overall looking downward.
Targets: 1.13200-1.12100-1.11000
Keep note, if the EUR / USD will crossover resistance 1 then it may try to touch resistance 2 so be careful with it.
Long term target: 1.08600

USDJPY is planning to take U-turn from Monday opening bell. It could show 111.22 levels, but it’s a trap for day traders. This week we will see 113 levels.
If you would like to dive for long term then 113 levels is best for sellers because USDJPY is overall down for big time.
For long term investors: once the USDJPY will be close below the 111.100 levels then we see 110.08-108.350-105.600 levels.
Get free forex & currency ideas, chart setups, and analysis for the upcoming session: Forex Signals →
Want to get premium trading alerts on GBPUSD, EURUSD, USDINR, XAUUSD, etc., and unlimited access to Moneymunch? Join today and start potentially multiplying your net worth: Premium Forex Signals
Premium features: daily updates, full access to the Moneymunch #1 Rank List, Research Reports, Premium screens, and much more. You΄ll quickly identify which commodities to buy, which to sell, and target today΄s hottest industries.
Have you any questions/feedback about this article? Please leave your queries in the comment box for answers.

