

Continue reading
 Yesterday, When I was reading articles on “Successful People Do To Reach Their Dreams”. Few things that these hungry and unstoppable people did to see the success they all eventually achieved. I read about Risk Point which is always existence. If you have strength to fight with Risky without surrender your self. Then you can be winner. Well…read what i read!
No risk, no reward. Yes it’s an over-used, cliché of a phrase. But it’s true. Those who have achieved real success have often risked the most to get there.
There have been billions of people throughout history who have had the ability to achieve greatness, whether it was the talent or smarts, they had it. What they didn’t have was the guts to risk the life that they were living. They also didn’t have the work ethic to see their talent realized.
The greatest tragedy in life is wasted talent ~ A Bronx Tale
Your big, audacious dream might be to marry the girl of your dreams and have a family with her. You risk might be to leave the career that you love in order to support her and your family. Your dream might be to help millions live longer, healthier lives. Whatever your dream is, give it enough of a chance to be realized.
Risk if you truly want to see the reward.
You will get daily one series of this Training after 8 o’clock night (Dinner Finished)
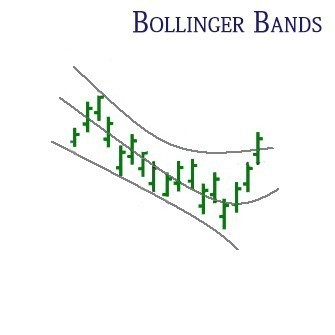
Effect of Bollinger Bands Oscillator
Whenever price crosses among the Bollinger band (upper or perhaps lower), a bullish or bearish event is generated hinging on the movement of the crossovers.
Story
A Bollinger bands use standard deviation along with a moving average to aid traders determine purchase and also provide activities, or perhaps to help confirm various other patterns. A price chart which utilizes Bollinger bands displays four lines; price, the upper and also lower Bollinger bands, along with the moving average.
The upper and also lower Bollinger bands usually appear 2 standard deviations above and additionally below the 20-day moving average. Recognia supports these typical setup.
For shorter-term trends, some technical analysts prefer 1 1/2 standard deviations by having a 10-day moving average. For longer-term trends, a 2 1/2 classique 50-day moving average might better suit their reasons.
Price tends to bounce between your upper and lower Bollinger bands. The width stuck between the bands does not remain constant. Usually, the growth or contraction of the bands indicates periods of high or low volatility.
Trading Factors
In Technical Analysis Explained, Martin J. Pring describes exactly how he interprets price charts which utilize Bollinger bands. Here is a summary of precisely what your man keeps in your mind whenever making trading decisions:
Use Bollinger bands that can help monitor and additionally anticipate price behavior. However, John Bolllinger himself acknowledges that other factors, for example RSI and additionally patterns, must be considered for trading choices.
Message for you(Trader/Investor): Google has the answers to most all of your questions, after exploring Google if you still have thoughts or questions my Email is open 24/7. Each week you will receive your Course Materials. You can print it and highlight for your Technical Analysis Training.
Wishing you a wonderful learning experience and the continued desire to grow your knowledge. Education is an essential part of living wisely and the Experiences of life, I hope you make it fun.
Learning how to profit in the Stock Market requires time and unfortunately mistakes which are called losses. Why not be profitable while you are learning?
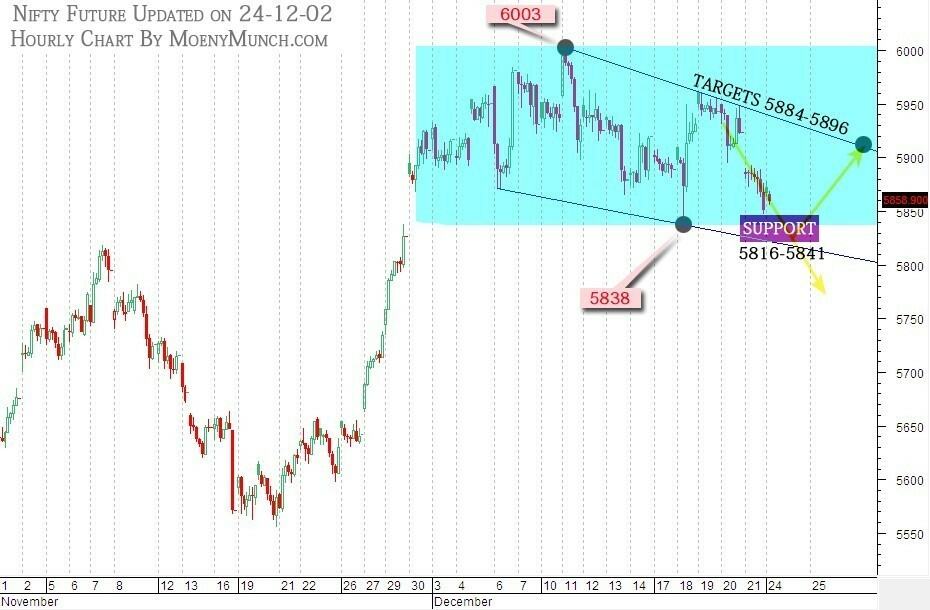
As mentioned in Chart Nifty future is trading 5850, just watch buyer will act level which is mentioned in chart.
To become a subscriber, subscribe to our free newsletter services. Our service is free for all.

THOUGHT FOR TODAY
——————————
Take Time To Laugh
Take time to laugh, it is the music of the soul. Take time to think, it is the source of power. Take time to read, it is the fountain of wisdom. Take time to love and be loved, it is a God-given privilege. Take time to work, it is the price of success.
Nifty Future
(Updated on 24-12-2012 at 07.40 AM)
On Friday mentioned break below 5886 would
drag Nifty fut up to 5850.
Nifty fut made low at 5847.40 and closed at 5853.40
Now for Today……….
5879-5885 is a strong hurdle.
Break below 5839 will trigger more downside up
to 5817-5809-5780.
Short term trend is bearish below 5900.
If Sustains above 5885 then rally up to 5911
not ruled out.
To become a subscriber, subscribe to our free newsletter services. Our service is free for all.
The Indian stock market declined for second consecutive week tracking weak global shares after
a Republican proposal to deal with a US fiscal crunch failed to get enough support, deepening
uncertainty over the US can avert the “fiscal cliff” of automatic spending cuts and tax increases
set to start Jan. 1.
Some key highlights during the week
• The RBI kept repo rates – the rate at which RBI lends to banks—and cash reserve ratio (CRR)
unchanged. However, the central bank has hinted that it may cut policy rates next month. The
government’s bold declaration not to exceed the original borrowing target of Rs.5.7 lakh crore
for the current fiscal has been a great comfort for the banks.
• Global rating agency Standard and Poor’s (S&P) has said it expects India to grow by 6.5%
during 2013, amidst the possibility of global economic recovery continuing during the year.
• Foreign direct investment inflows into India jumped 67% in October to $1.94 billion, a
government statement said on Friday, but inflows for the current financial year were still down.
Total FDI inflows in the first seven months for the current fiscal year that began in April were
down 42% from a year earlier at $14.79 billion.
• India’s holding of US government debt securities has declined for the second consecutive
month, even as many other countries including China, Japan, Brazil and Russia hiked their
exposure to American treasury bonds. As per the latest data released by the US Department
of Treasury, India’s holding of treasury securities stood at $58.9 billion (over Rs 3,20,000
crore) at the end of October 2012 — marking the second straight month of decline after an
uptrend for seven continuous months. However, the holdings of countries like China, Japan,
Brazil, Switzerland, Russia, France and Canada rose during October. At the end of the month,
India was the 18th largest holder of the US treasury bonds, while China was the largest
foreign owner of these securities followed by Japan, Brazil, Taiwan, Switzerland, Russia,
Luxembourg, Hong Kong, Belgium and the UK in the top ten.
• The Government lowered the growth projection for the current financial year to 5.7-5.9%,
while pitching for supportive monetary and fiscal policies to improve investor confidence. The
economy, it added, would have to record a growth rate of 6% in second half of the current
financial year to reach the desired growth rate. It grew by 5.4% during April-September 2012-
13. The economic survey had pegged the growth rate at 7.6% for this fiscal. To achieve 5.7-
5.9% growth, the analysis said, “both fiscal and monetary policy, however, would need to be
supportive to sustain investor confidence. The government will also have to address the
concerns relating to structural supply side bottlenecks”.
US Markets
US markets weakened this week, as a new setback in talks to avert a U.S. fiscal crisis and
evidence of Europe’s ongoing economic difficulties stoked investor nerves. For the week, the
three major U.S. stock indexes posted gains, with Dow Jones up 0.4%, S&P 500 up 1.2% and
Nasdaq Composite Index up 1.7%.
Key Highlights during the week:
• The December 2012 Empire State Manufacturing Survey indicates that conditions for New
York manufacturers continued to decline at a modest pace. The general business conditions
index was negative for a fifth consecutive month, falling three points to -8.1. The new orders
index dropped to -3.7, while the shipments index declined six points to 8.8. At 16.1, the prices
The markets may remain volatile next week as traders roll over positions in the F&O segment
from the near month December 2012 series to January 2013 series. The near-month December
2012 derivatives contracts expire on Thursday, December 27, 2012. Investors are likely to keep
a close on watch on the developments on the US ‘fiscal cliff’ which could especially affect
software service exporters such as Infosys and TCS. Indian companies will start unveiling Q3
December 2012 results from mid-January 2013.
To become a subscriber, subscribe to our free newsletter services. Our service is free for all. Unlock This Article