Optimistic Outlook Optimism opens a door in difficult or hopeless situations. No matter what the crisis, an optimist maintains the outlook that it is a sign, time for a different way of thinking, or of doing things. Sometimes the signal has to be very clear even harsh, otherwise we may continue in self-delusion and not wake up. Of course if we lack optimism, instead of taking this signal as a step towards renaissance, complaint, resentment or even desperation will emerge.
Nifty spot
(Updated on 27-12-2012 at 07.20 AM)
Yesterday mentioned Nifty fut had resistance at 5931.
It could not cross over 5931 and made high at 5930.80
Strategy for Nifty spot for Today
Break below 5862 Expect slides up to 5851-5844
Nifty spot has strong support at 5844-5836 region.
5893-5902 Intraday resistance.
Crossover 5910 may take up to 5919-5928.
Decisive Break below 5836 may take NF up to 5814-5800.
To become a subscriber, subscribe to our free newsletter services. Our service is free for all.
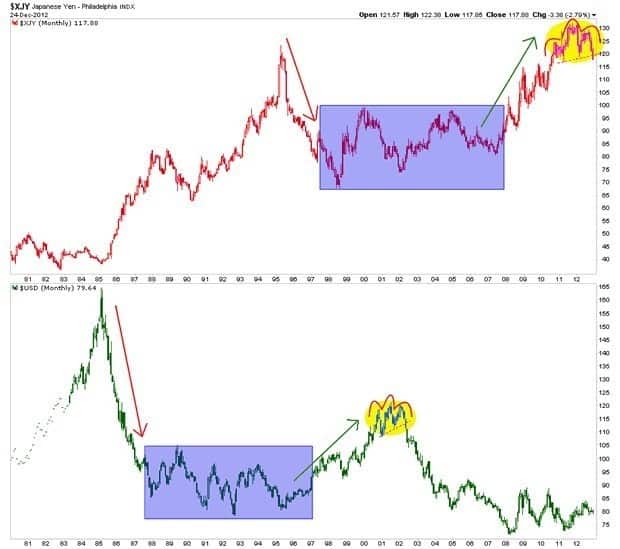
Japan is following in the footsteps of the man who laid the groundwork for the greatest global inflationary operation of the modern era. We see the Yen in the top panel of the chart below forming a similar pattern to that which USD made from 2000 to 2002 as an epic bubble in credit expansion was being fomented in the US.
The similarity in the charts (with a decade stagger) is striking and it is probably no coincidence that Japan has chosen to leverage its currency – which had been chronically strong since the 2007 beginnings of the US-triggered global financial meltdown – just as the US did with the once strong ‘King’ dollar in and around 2001.


 Unlock This Article