Controls on gold inflows don’t fix the causes of capital outflows.
What’s going on in India is nothing new. We’ve seen it over and over again throughout struggling economies.
These attempts to control movement of currency are very common when a government is faced with problems like India’s. They actually create a more crippling environment than the one they are put in place to improve.
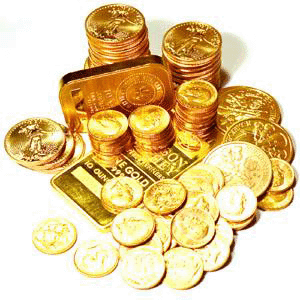
Gold has always been and will always be the safe haven of choice when people lack confidence in their government. Lacking confidence doesn’t only mean that they’re not certain they’ll perform well, but it also may mean that they don’t trust their government to operate in their best interest. Starting with allowing economic freedom, and defending the value of the currency.
What are these currency controls recently put on gold in India?
They’ve prohibited and restricted loans to customers of gold bullion;They’ve raised the import tax on both gold and silver to 10%;The sale of gold may only be made to jewelers or bullion dealers to supply the jewelry industry;Gold importers must ensure that 20% of all gold imported is to be exported as product. Continue reading
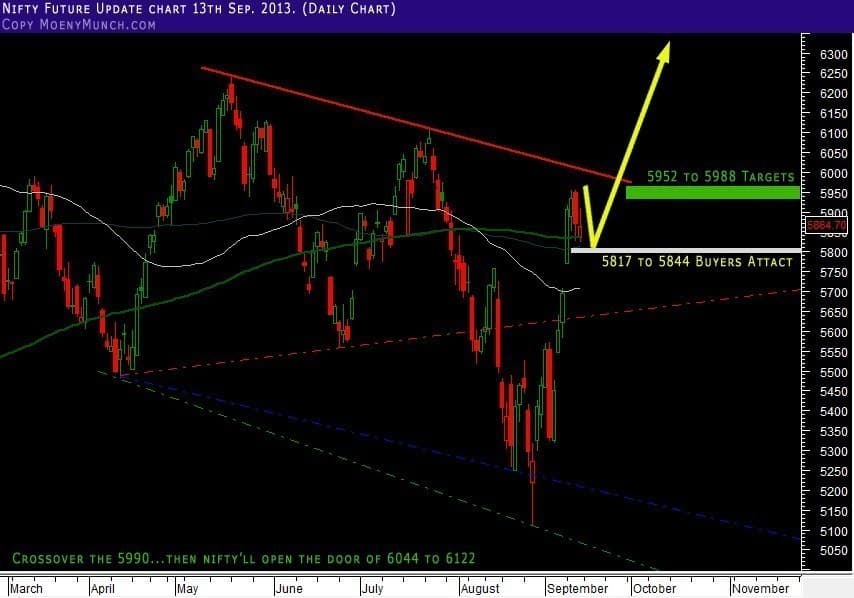
SELL MCX GOLD @ 30650 OR ABOVE S/L: FOR PAID MEMBER TARGETS: 30550 – 30440 – 30330 [LOW RISK – TRADE WITH MED QTY] RISK: ONLY SUBSCRIBE KNOW PROFIT: 300+
To become a subscriber, subscribe to our free newsletter services. Our service is free for all.
This is the 25th Day course in a series of 60-Days called “Technical Analysis Training”
You will get daily one series of this Training after 8 o’clock night (Dinner Finished)
Follow MoneyMunch.com Technical Analysis Directory and Learn Basic Education of Technical Analysis on the Indian Stock Market (NSE/BSE)
Slow Stochastic Oscillator
Implication
Bullish: %K and %D lines fall below and then rise above the 20 threshold, indicating bullish potential, along with a %K line cross above the %D line, triggering a bullish signal event if these 3 crossovers occur within a 5-day period.
Bearish: %K and %D lines rise above and then fall below the 80 threshold, indicating bearish potential, along with a %K line cross below the %D line, triggering a bearish signal event if these 3 crossovers occur within a 5-day period.
Description
The slow stochastic oscillator compares two lines called the %K and %D lines to predict the possibility of an uptrend or a downtrend. In price charts, the %K line typically appears as a solid line, and the %D line appears as a dotted line. The slow stochastic oscillator can be used effectively to monitor daily, weekly or monthly periods.
According to Martin J. Pring, George Lane developed the stochastic oscillator with the premise that during an uptrend, the closing price tends to rise. However, when the uptrend matures, price tends to close towards the bottom of the price range for the period. Likewise, in a downtrend, the reverse holds true.
The difference between the slow and fast stochastic oscillators is the way that the %K and %D values are calculated. Slow stochastic are based on the moving averages values calculated for fast stochastic. As such, John J. Murphy writes that most traders favor slow stochastic because they tend to be more reliable.
%K
For slow stochastic, the %K value is based on a 3-period moving average of the %K fast stochastic value. See fast stochastic for information about the %K calculation.
%D
For slow stochastic, the %D value is based on a 3-period moving average of the %K slow stochastic value (described above).
Pring identifies that a way to differentiate the %K line from the %D line is to remember that %K represents “Kwick” movements, while %D shows movements that “Dawdle”. As such, Edwards and Magee note that “[ordinarily], the %K Line will change direction before the %D Line. However, when the %D line changes direction prior to the %K line, a slow and steady Reversal is often indicated.”
Trading Considerations
This section identifies that inform trading decisions using stochastic. It should be pointed out, that many technical analysts use stochastic in combination with other patterns or oscillators. John J. Murphy, for example, suggests that “[one] way to combine daily and weekly stochastic is to use weekly signals to determine the market direction and daily signals for timing. It’s also a good idea to combine stochastic with RSI.”
When you are using stochastic with price charts, keep the following factors in mind:
Extremes
When the %K line nears the 100% or 0% line a powerful move is set to occur. Some technical analysts equate the extremes with overbought or oversold conditions, and that prices cannot get any higher or lower. However, Edwards and Magee identify that this is not true in all situations, and that the extremes instead represent the strength of a price move.
Divergences
A divergence is said to have occurred when the price and oscillator trend lines move in different directions. A price reversal may follow.
Hinges
Lane referred to a flattened %K or %D line as hinges. A hinge may indicate that the uptrend or downtrend has become exhausted, and that a price reversal may occur.
Crossovers
When the price has reached 80 or higher, and a divergence has occurred, a crossover is the sell signal. To summarize Lane, Robert W. Colby writes that “the sell signal is more reliable when %D has already turned down when %K crosses below %D”.”
Similarly, when the price has reached 20 or lower, and a divergence has occurred, a crossover becomes the buy signal. Robert W. Colby writes that “the buy signal is more reliable when %D has already up down when %K crosses above %D”.”
Message for you(Trader/Investor): Google has the answers to most all of your questions, after exploring Google if you still have thoughts or questions my Email is open 24/7. Each week you will receive your Course Materials. You can print it and highlight for your Technical Analysis Training.
Wishing you a wonderful learning experience and the continued desire to grow your knowledge. Education is an essential part of living wisely and the Experiences of life, I hope you make it fun.
Learning how to profit in the Stock Market requires time and unfortunately mistakes which are called losses. Why not be profitable while you are learning?
This is the 24th Day course in a series of 60-Days called “Technical Analysis Training”
You will get daily one series of this Training after 8 o’clock night (Dinner Finished)
Follow MoneyMunch.com Technical Analysis Directory and Learn Basic Education of Technical Analysis on the Indian Stock Market (NSE/BSE)
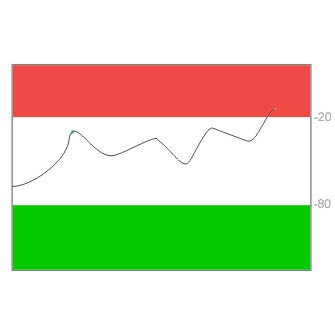
Williams %R Oscillator
Bullish: %R goes up again above -80 and remains to traverse above the -50 line within 14 days. We recognize an function at the -50 line borrowing.
Bearish: %R reduces back here -20 and keeps going to cross just below the -50 line just in 14 days. We recognize an occasion at the -50 line borrowing.
Description
The %R oscillator is very similar to the stochastic oscillator. However, the %R oscillator is expressed in negative values. For simplicity, many technical analysts would suggest that you ignore the negative symbols altogether. The goal of the %R oscillator is to detect overbought or oversold conditions. According to John J. Murphy, the %R oscillator measures “the latest close in relation to its price range over a given number of days”. The specific calculation for the %R oscillator is freely available on the web and other resources. Recognia uses a 14-day period to detect events, which is the typical period to monitor.
Trading Considerations
When the %R line nears the -80% line an oversold condition may occur, causing a price reversal. Likewise, when the %R line nears the -20% line an overbought condition may occur. Some technical analysts prefer to use the -75% and -25% lines to indicate oversold/overbought conditions.
It should be pointed out that an event at the -80% or -20% lines does not necessitate a price reversal. In fact, the price can continue to rise or fall.
Divergence will give you a better sense of the likelihood of a price reversal. Divergence occurs when the price and oscillator trend lines move in different directions. When a divergence occurs, a price reversal may follow.
Message for you(Trader/Investor): Google has the answers to most all of your questions, after exploring Google if you still have thoughts or questions my Email is open 24/7. Each week you will receive your Course Materials. You can print it and highlight for your Technical Analysis Training.
Wishing you a wonderful learning experience and the continued desire to grow your knowledge. Education is an essential part of living wisely and the Experiences of life, I hope you make it fun.
Learning how to profit in the Stock Market requires time and unfortunately mistakes which are called losses. Why not be profitable while you are learning?