At times it’s very challenging to move on, but at one time you move, you’ll understand, it was the Best choice. You’ve Ever Made.
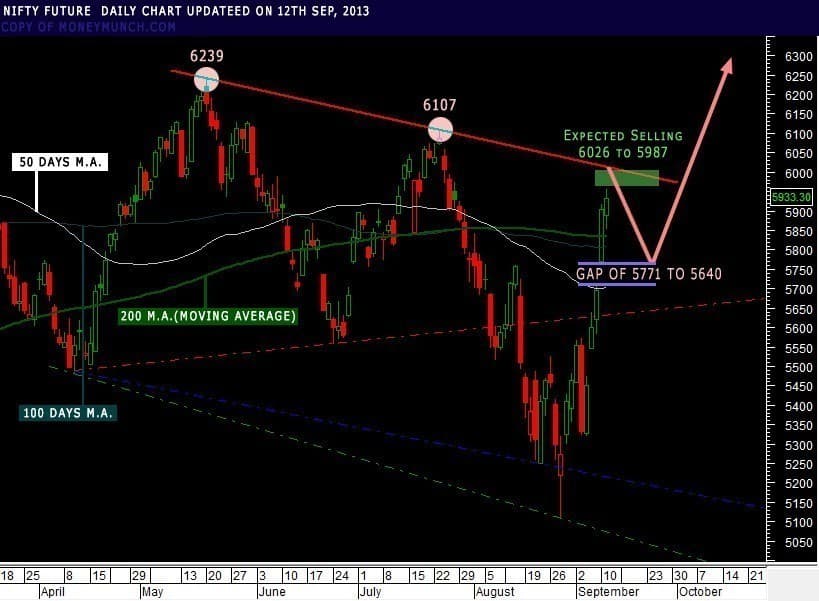
BULLS ARE RESTORING THE LEAD FOR NSE NIFTY FUTURE
A unexpected improvement of key geopolitical risk, good numbers from China and the belief of a light tapering have switched on risk appetite, weakness in dollar uv rupees.
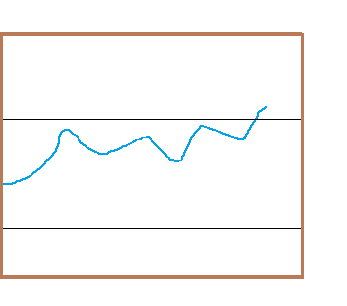
Price managed to close above crucial moving averages.On the chart shows a potential resistance line which set up 6030. In the coming days, short sellers will create good position on short side200-300 Points of short fall expected only, therefore don’t create overload position on short side.Market is still good for up move, just expected short term fall…[/list]
To become a subscriber, subscribe to our free newsletter services. Our service is free for all.
Unlock This Article
Only subscribers can read the full article. Please login to read the entire article.
Remember: Trends never reverse quickly but tops are very defined. Reversals take time to build and result in specific patterns. The first big drop almost always finds buyers, and the first spike almost always finds sellers.
To become a subscriber, subscribe to our free newsletter services. Our service is free for all.
This is the 23th Day course in a series of 60-Days called “Technical Analysis Training”
You will get daily one series of this Training after8 o’clock night (Dinner Finished)
Follow MoneyMunch.com Technical Analysis Directory and Learn Basic Education of Technical Analysis on the Indian Stock Market (NSE/BSE)
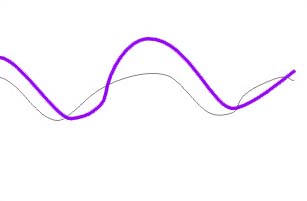
Relative Strength Index (RSI)
Implication
When the RSI falls below 30 (a Technical Analysis), a bullish signal is generated. When the RSI rises above 70, the Technical Analysis is a bearish signal.
Description
The Relative Strength Index (RSI) is an oscillator that measures a particular financial instrument’s current relative strength compared to its own price history. The RSI should not be confused with relative strength which rates a financial instrument in relation to a market such as the S&P index.
The RSI is plotted on a vertical scale numbered from 0 to 100. The formula to calculate the RSI is 100-[100/(1+A)] where A is the average of the “up” closes over the calculation period divided by the average of the “down” closes over the calculation period.
Different calculation periods can be used. The most popular is a 14-day period. The “A” for a 14-day period is calculated by dividing the 14-day “up” close average by the 14-day “down” close average. An “up” close or a “down” close is defined as the absolute change in price from close to close.
Trading Considerations
The RSI sometimes shows more clearly than the price chart itself the support and resistance lines for a financial instrument. Failure Swings which are also known as support or resistance penetrations or breakouts can be detected by using the RSI. Failure swings occur when the RSI passes a previous high or falls below a recent low. Divergences (when market trends go in a different direction than market indicators predicted, usually signifying the onset of a trend change) occur when the price makes a new high (or low) that is not confirmed by a new high (or low) in the RSI. Prices usually correct and move in the direction of the RSI. A financial instrument is considered to be oversold when its RSI falls below 30 and overbought when its RSI rises over 70.Message for you(Trader/Investor): Google has the answers to most all of your questions, after exploring Google if you still have thoughts or questions my Email is open 24/7. Each week you will receive your Course Materials. You can print it and highlight for your Technical Analysis Training.
Message for you(Trader/Investor): Google has the answers to most all of your questions, after exploring Google if you still have thoughts or questions my Email is open 24/7. Each week you will receive your Course Materials. You can print it and highlight for your Technical Analysis Training.
Wishing you a wonderful learning experience and the continued desire to grow your knowledge. Education is an essential part of living wisely and the Experiences of life, I hope you make it fun.
Learning how to profit in the Stock Market requires time and unfortunately mistakes which are called losses. Why not be profitable while you are learning?
This is the 21th Day course in a series of 60-Days called “Technical Analysis Training”
You will get daily one series of this Training after 8 o’clock night (Dinner Finished)
Follow MoneyMunch.com Technical Analysis Directory and Learn Basic Education of Technical Analysis on the Indian Stock Market (NSE/BSE)
Moving Average Convergence/Divergence (MACD) Oscillator
Implication
If the MACD crosses the signal line or the zero line (the event), a bullish or bearish signal is created based on the direction of the crossovers.
Description
The MACD, “Moving Average Convergence/Divergence”, tells the connection in between two moving averages of prices. The MACD is the difference between a 26-day and 12-day exponential moving average. A 9-day exponential moving average named the “signal line” is plotted on top of the MACD to give bullish and bearish signal tips. A bullish signal is created after the MACD rises above the signal line, or above zero. A bearish signal happens after the MACD comes below the signal line or below zero.
Trading Considerations
The MACD is most effective in powerfully finding trend of markets.
The MACD suggests overbought and oversold situations. An overbought situation happens whenever prices have increased too far too fast and also are set for a downward correction. An oversold situation happens whenever prices have fallen too far too fast and are set for an upward correction. When the shorter moving average pulls away from the longer moving average (i.e., the MACD rises), it’s probably that the financial instrument’s price is too high and will soon get back to more realistic levels.
An indication that an end to the current trend may be near happens whenever MACD diverges through the financial instrument’s price. A bearish divergence happens whenever MACD is making new lows while prices fail to reach new lows. A bullish divergence occurs whenever the MACD is making new highs while prices are unsuccessful to reach new highs. These two divergences are most significant when they happen at comparatively overbought/oversold levels.
Message for you(Trader/Investor): Google has the answers to most all of your questions, after exploring Google if you still have thoughts or questions my Email is open 24/7. Each week you will receive your Course Materials. You can print it and highlight for your Technical Analysis Training.
Wishing you a wonderful learning experience and the continued desire to grow your knowledge. Education is an essential part of living wisely and the Experiences of life, I hope you make it fun.
Learning how to profit in the Stock Market requires time and unfortunately mistakes which are called losses. Why not be profitable while you are learning?
MCX Silver and Gold both is running opposite and for clear understanding, you should to compare with USDINR + GOLD + SILVER, it will give me exact direction idea!
Dear readers, I have one tip for you: New support 31,432 level
If gold close below my support then without any question, gold will go down 31,226 – 31,122 – 30,916 below and If it will not close below your support? Simple, 32000 – 32500 – 33000+ Now choice is yours!
MCX Silver is very clear. If it closes below 52,431 level then it will downside 50,356 – 48,621 – 46,885 – 45,509. I am sure, this week Silver will show you strong movement but I expect it will dance between 57,313 to 52,431 levels.
There is clear signal for long term investor, once MCX Silver close above 57,313 then it will kiss 59,912 – 61,254 – 63,401+
Now you have a question, what about Intraday?
Obviously, silver is not good for intraday. I think it should become around 53,412 level, and it will try to test 52,431 level in between 2-3 trading sessions.
To become a subscriber, subscribe to our free newsletter services. Our service is free for all.
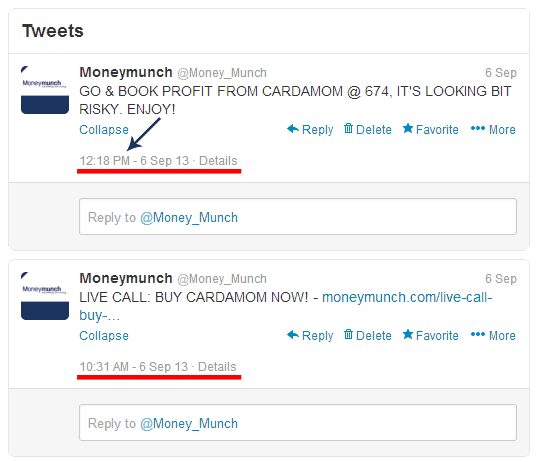
I have seen some people are talking about Cardamom call. First of all let me show you something, read our below tweet: Our subscribers and everyone booked full profit! Moneymunch Twitter Profile: https://twitter.com/Money_Munch
This is the 22th Day course in a series of 60-Days called “Technical Analysis Training”
You will get daily one series of this Training after 8 o’clock night (Dinner Finished)
Follow MoneyMunch.com Technical Analysis Directory and Learn Basic Education of Technical Analysis on the Indian Stock Market (NSE/BSE)
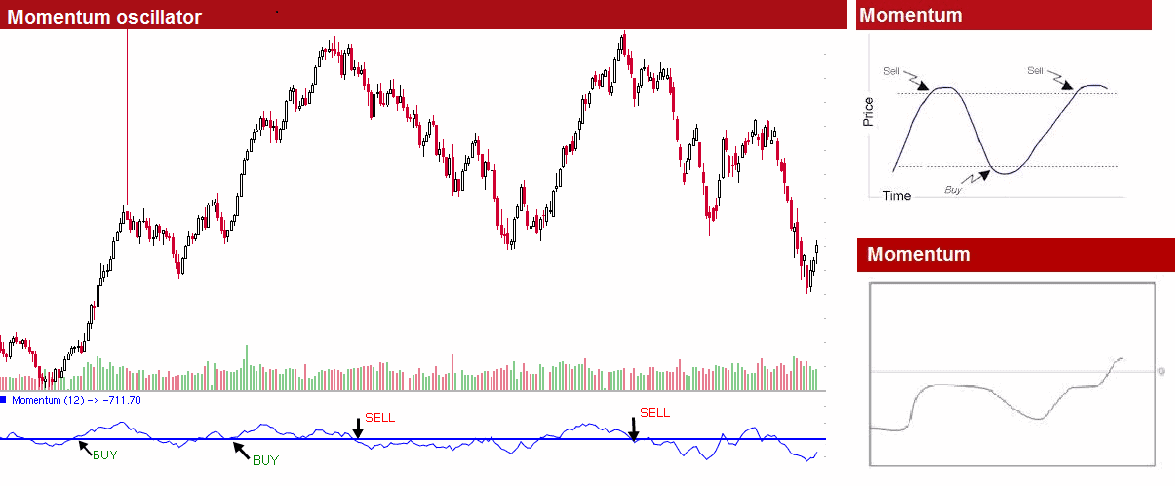
Momentum Oscillator
Effect of Momentum Oscillator
Momentum measures the amount that a financial instrument’s price has changed over a given timeframe. Momentum is significant because it signals the strength of price trends.The Momentum rises above 0 , a bullish noticeable is cause. When the Momentum falls below 0, the Technical Analysis is a bearish signal.
Narration
Momentum measures the amount that a financial equipment price has changed over a given time frame Momentum is important because it indicate the strength of price trends. A healthy price trend tends to show strong momentum, while decline trends generally have decreasing momentum indicating a trend reversal or correction. Momentum can also indicate short-term market excess referred to as overbought and oversold levels. A bullish signal is generated when the Momentum rises above 0 and a bearish signal is generated when the Momentum falls below 0.
Momentum is calculated as a ratio of today’s price compared to the price n periods ago. The formula is [Close/(Close n time-periods ago) times 100].
Trading Factor:
Momentum can be used as a trend-following oscillator similar to the MACD. A bullish indicate is achieved when the indicator bottoms and turns up. A bearish signal is achieved when the indicator peaks and turns down.
If the Momentum indicator influence extremely higher low values (relative to its historical values),
a continuity of the current trend may be called for. For example, if the Momentum indicator reaches extremely high values and then turns down, one could predict prices will probably go still higher.In either case, only trade after prices confirm the signal generated by the indicator (e.g., if prices peak and turn down, wait for prices to begin to fall before selling).
The Momentum indicator can also be used as a leading indicator.This method assumes that market tops are typically identified by a rapid price increase (when everyone expects prices to go higher)and that market bottoms typically end with rapid price declines (when everyone wants to get out). As a market peaks, the Momentum indicator will climb sharply and then fall off–diverging from the continued upward or sideways movement of the price.
Similarly, at a market bottom, the Momentum indicator will drop sharply and then begin to climb well ahead of prices.Both of these situations result in divergences between the indicator and prices.
Message for you(Trader/Investor): Google has the answers to most all of your questions, after exploring Google if you still have thoughts or questions my Email is open 24/7. Each week you will receive your Course Materials. You can print it and highlight for your Technical Analysis Training.
Wishing you a wonderful learning experience and the continued desire to grow your knowledge. Education is an essential part of living wisely and the Experiences of life, I hope you make it fun.
Learning how to profit in the Stock Market requires time and unfortunately mistakes which are called losses. Why not be profitable while you are learning?
 Unlock This Article