More than anything else, what differentiates people who live up to their potential from those who don’t is a willingness to look at themselves and others objectively. – Ray Dalio
Yesterday Nifty closed up 106.65 points at 5448.10 while Nifty futures closed at 5458.05, a premium of 9.95 points. FIIs bought in Cash, net buy 172.53 Crore while DIIs sold in Cash, net sell 222.36 Crore. FIIs bought in Index future, Stock future but sold in Index Option, net buy 780.65 Crore!
What for today…?
selling pressure expected after 11 o’clock….
5622 to 5642 targets 5555 and 5300
To become a subscriber, subscribe to our free newsletter services. Our service is free for all.
My experience indicates that most people who’ve accumulated a great deal of wealth haven’t had that as their goal at all. Wealth is only a by-product, not the original motivation. – Michael Milken
Nifty closed up 78.95 points at 5550.75 while Nifty future closed at 5554.60, premium of 3.85 points. FIIs bought in Cash, net buy 475.92 Crore while DIIs sold in Cash, net sell 285.81 Crore. FIIs bought in Stock future, Index future but sold in Index future, net buy 996.42 Crore.
Yesterday we told!
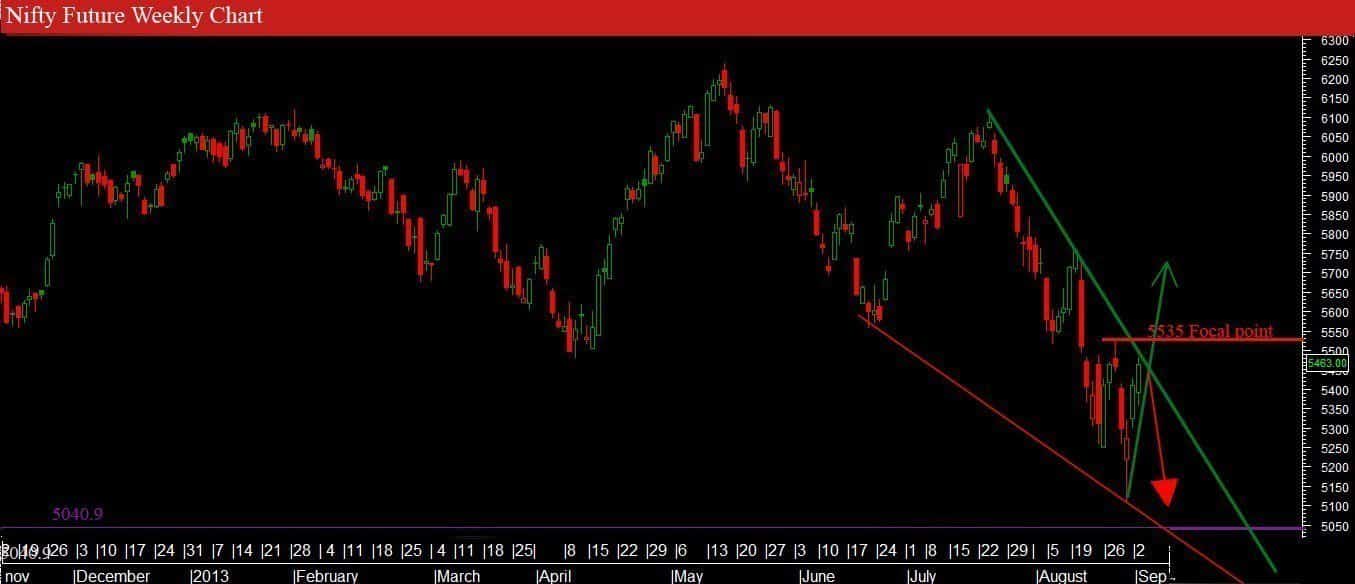
Yes noon we updated weekly chart showing fresh position for bull’s.
We said 5535 is the point to be watch out very care fully if it crosses conformation for bullish trend.
What for Today?
Today, Nifty Future strongly favor bull to gain.
Nifty will possibly check the 5600 if the movement remain same
be surly check level indicated in weekly chart of 5642.
This is the 22th Day course in a series of 60-Days called “Technical Analysis Training”
You will get daily one series of this Training after 8 o’clock night (Dinner Finished)
Follow MoneyMunch.com Technical Analysis Directory and Learn Basic Education of Technical Analysis on the Indian Stock Market (NSE/BSE)
Corrective Waves
Effect of Corrective Waves
Markets move against the trend of one greater amount only with a seeming conflict. Resistance from the greater trend appears to forbid a correction from establish a full impulsive format. The struggle between the two oppositely trending amount generally makes corrective waves less clearly identifiable than impulsive waves, which always flow with comparative ease in the direction of the one greater trend. As another result of the conflict between trends, corrective waves are quite a bit more varied than impulsive waves.
Corrective patterns fall into four main categories:
Zigzags (5-3-5; includes three variations: single, double, triple); Flats (3-3-5; includes three variations: regular, expanded, running); Triangles (3-3-3-3-3; four types: ascending, descending, contracting, expanding); Double threes and triple threes (combined structures).
ZIGZAGS (5-3-5)
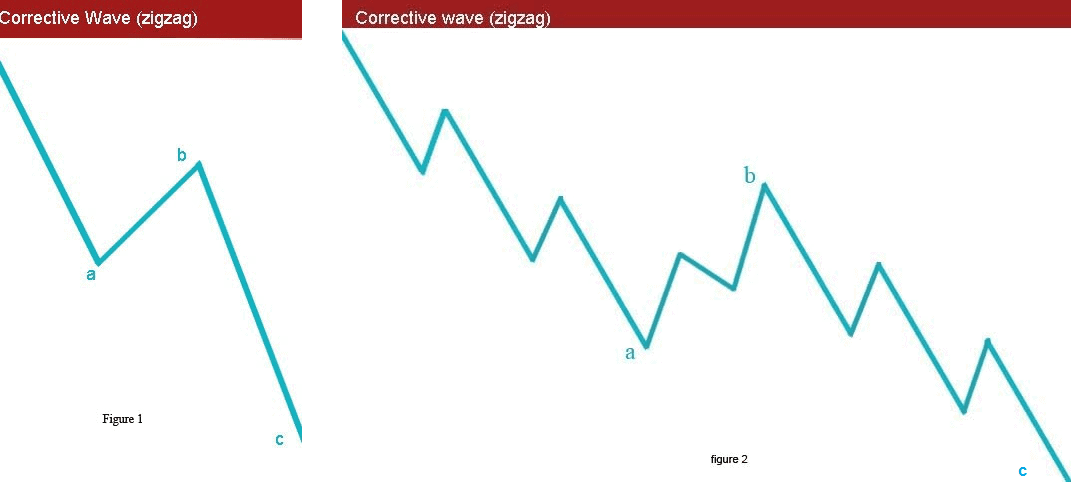
A single zigzag in a bull market is a simple three-wave declining pattern labeled A-B-C and subdividing 5-3-5. The top of wave B is noticeably lower than the start of wave A, as illustrated in Figures 1 and 2.
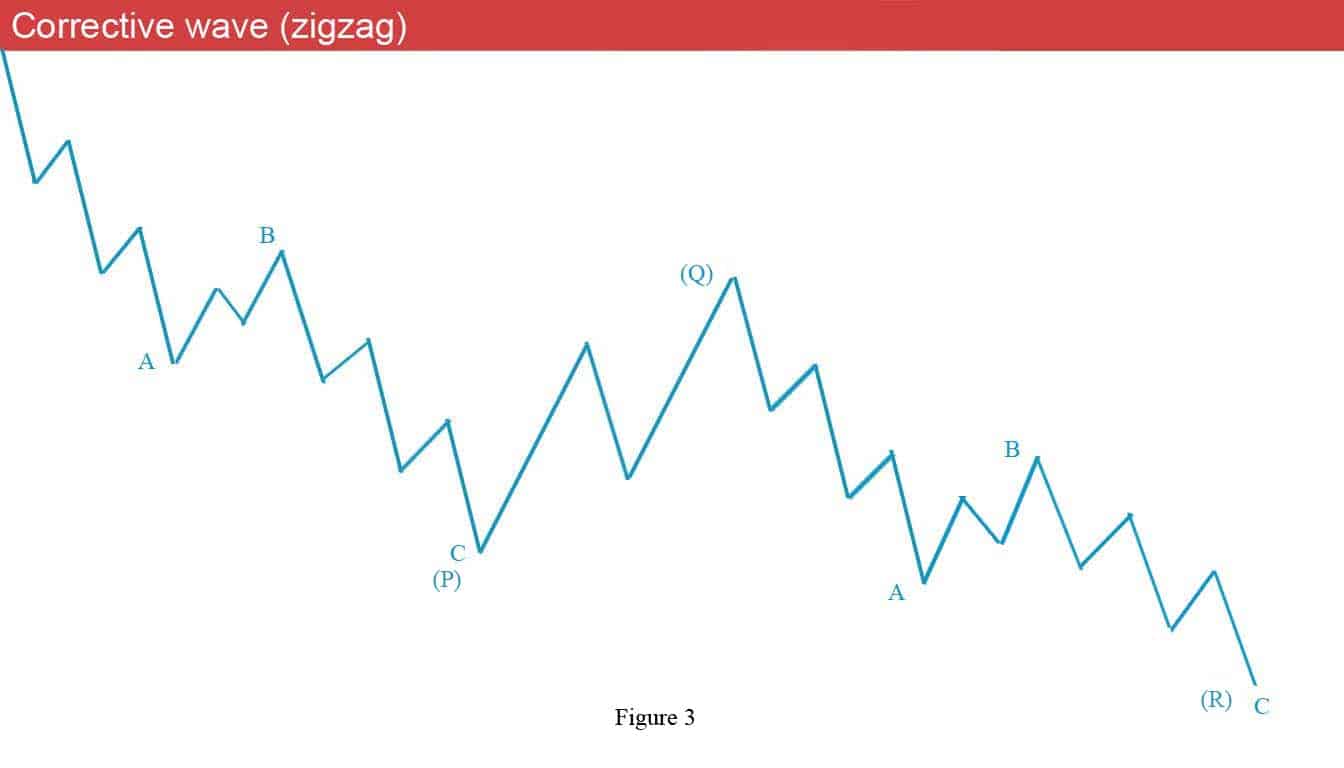
hardly zigzags will occur twice, or at most, three times in series, especially when the first zigzag falls short of a normal target. In these cases, each zigzag is separated by an intervening “three” (labeled Q), producing what is called a double zigzag (see Figure 3) or triple zigzag. The zigzags are labeled P and R (and S, if a triple)
FLATS (3-3-5)
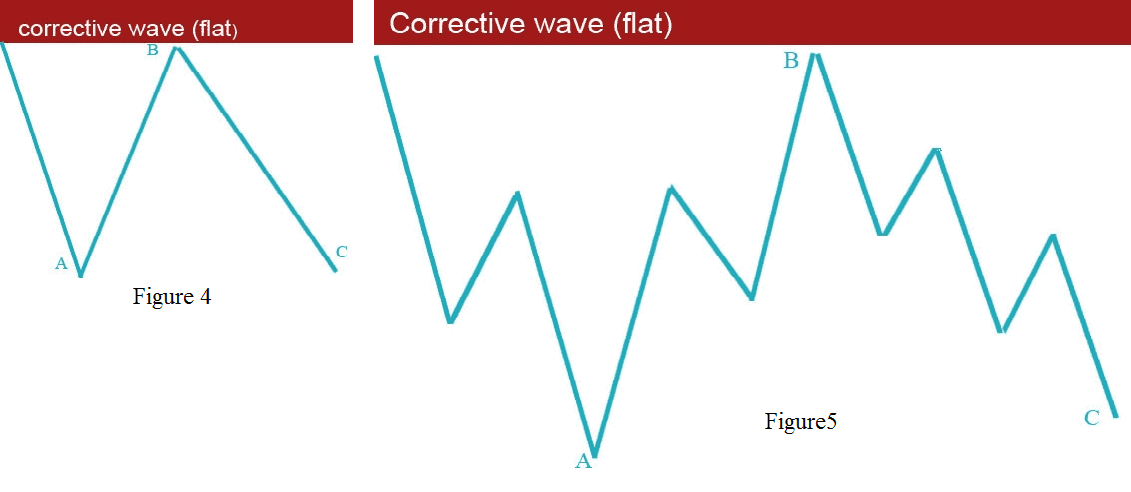
A flat correction vary from a zigzag in that the subwave progression is 3-3-5, as shown in Figures 4 and 5. Since the first actionary wave, wave A, lacks sufficient downward force to unfold into a full five waves as it does in a zigzag, the B wave reaction seems to innerit this lack of countertrend burden and, not surprisingly, abolish near the start of wave A. Wave C, in turn, generally terminates just slightly beyond the end of wave A rather than somewhat beyond as in zigzags.
Flat corrections usually retrace less of preceding impulse waves than do zigzags. They participate in periods involving a strong greater trend and thus essentially always precede or follow extensions. The more strom the underlying trend, the briefer the flat tends to be. Within impulses, fourth waves frequently sport flats, while second waves barely do.
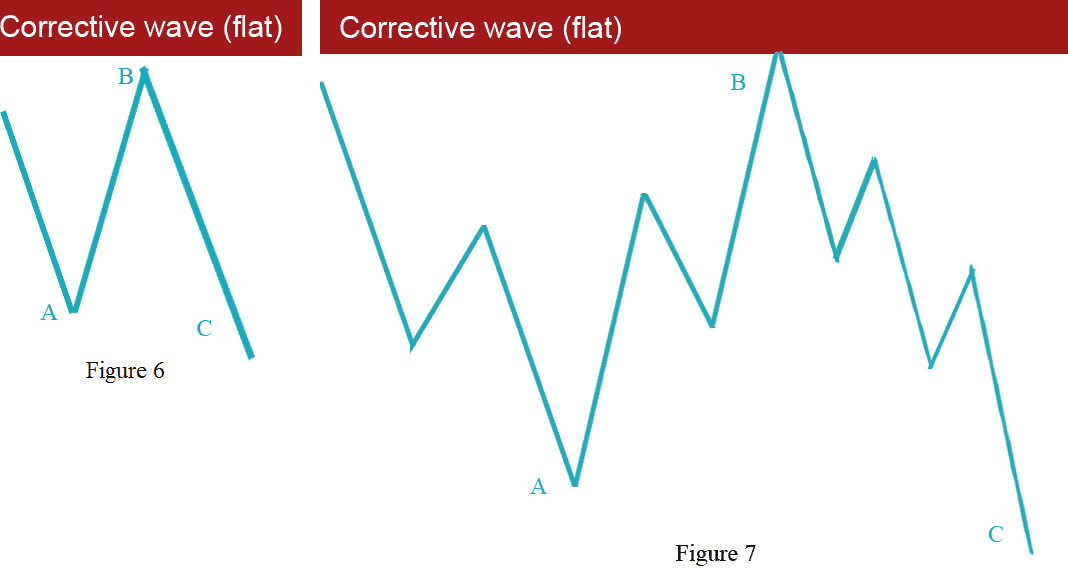
Three types of 3-3-5 corrections have been analyze by variation in their overall shape. In a regular flat correction, wave B terminates about at the level of the beginning of wave A, and wave C terminates a slight bit past the end of wave A, as we have shown in Figures 4 and 5. Far more common, however, is the variety called an expanded flat, which contains a price extreme beyond that of the preceding impulse wave. In expanded flats, wave B of the 3-3-5 pattern terminates beyond the starting level of wave A, and wave C ends more extensively beyond the ending level of wave A, as shown in Figures 6 and 7. In a rare variation on the 3-3-5 pattern, which we call a running flat, wave B terminates well beyond the beginning of wave A as in an expanded flat, but wave C fails to travel its full distance, falling short of the level at which wave A ended. There are hardly any examples of this type of correction in the record.
Message for you(Trader/Investor): Google has the answers to most all of your questions, after exploring Google if you still have thoughts or questions my Email is open 24/7. Each week you will receive your Course Materials. You can print it and highlight for your Technical Analysis Training.
Wishing you a wonderful learning experience and the continued desire to grow your knowledge. Education is an essential part of living wisely and the Experiences of life, I hope you make it fun.
Learning how to profit in the Stock Market requires time and unfortunately mistakes which are called losses. Why not be profitable while you are learning?