I don’t need to write something new here. You can check my 09 SEP article about Silver: https://moneymunch.com/weekly-outlook-of-mcx-gold-and-silver-cardamom-update/There, I had written where silver will go! For to know more about Silver, subscribe to our free newsletter services. Our service is free for all.
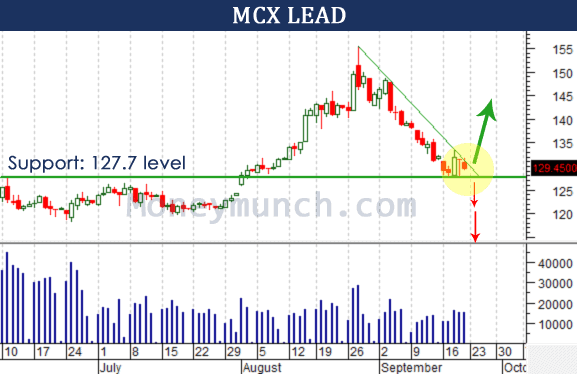
Look at above chart, you can see support 127.7. Once MCX lead cross and close below for 1-2 trading session means it will touch 126 – 124.2 – 122.5 – 120.5 levels non-stop. If lead not close below support means it will definitely kiss 134.6 – 139.2 – 140.6 – 143.8 levels without single one stop! Now the choice is yours! Exact direction with Stop loss for subscribers only!
Crude oil is at very crucial level. subscribers, are you ready for long-term position? Today, I will update for you only @ opening bell!
Cardamom is looking awfully downward. I feel we should sell it. Intraday Targets: 747-743 & Short term targets: 738-734 below Yes, it stop loss is last week high for users. subscribers, you will get stop loss soon.
Guar seed is the best pick for this week. You can sell it with targets: 6466-6394. S/L is available for subscribers only!
This is the 34th Day course in a series of 60-Days called “Technical Analysis Training”
You will get daily one series of this Training after8 o’clock night (Dinner Finished)
Follow MoneyMunch.com Technical Analysis Directory and Learn Basic Education of Technical Analysis on the Indian Stock Market (NSE/BSE)
Megaphone Top Chart Pattern
Implication
A Megaphone Top also recognized as a Broadening Top is regarded a bearish signal, indicating that the existing uptrend may reverse to form a newer downtrend.
Description
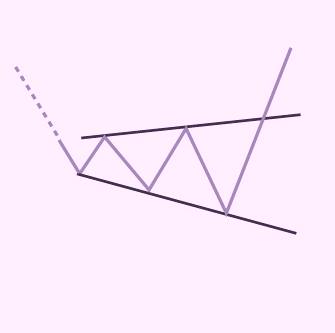
A Megaphone Top is a reasonably scarce creation and is also popular as a Broadening Top. Its shape is reverse to that of a Symmetrical Triangle. The pattern grows after a intense further in a stock price and can last a number of weeks or even a few months.
A Megaphone Top is developed because the stock creates a collection of higher highs and lower lows. The Megaphone Top normally is made up of three ascending peaks and two descending troughs. The signal that the pattern is finish happens when prices fall below the lower low.
Volume in the Megaphone Top generally peaks together with prices. It is normal to notice trading volumes enhance or stay high during the development of this pattern. The ultimate breakout and reversal can be complicated to determine at the time of its incident because volume does not look interesting.
Trading Considerations
Target Price
The target price produces an significant signal about the potential price move that this pattern shows. Think about whether the target price for this pattern is enough to supply appropriate comes back after your costs (such as commissions) have been taken into account. A ideal rule of thumb is that the target price must suggest a potential return of greater than 5% before a pattern should be regarded helpful, nevertheless you should consider the existing price and the volume of shares you intend to trade.
Criteria that Supports
Volume
Volume in the Megaphone Top usually peaks along with prices. A strong volume spike on the day of the pattern confirmation is a strong indicator in support of the potential for this pattern.
Underlying Behavior
The production of the pattern demonstrates a stage of time where bulls and bears are fighting to build control of the stock. The pattern takes place after the bulls have been asking and driving the stock price substantially higher. During the development of the Megaphone Top, then again, bears are applying growing impact on the stock and causing it to ready a collection of lower lows. The improving excitability ultimately produces a sense of anxiety, prospects to profit-taking, and deters many of the bulls from making any additional responsibilities. The bears ultimately triumph.
Message for you(Trader/Investor): Google has the answers to most all of your questions, after exploring Google if you still have thoughts or questions my Email is open 24/7. Each week you will receive your Course Materials. You can print it and highlight for your Technical Analysis Training.
Wishing you a wonderful learning experience and the continued desire to grow your knowledge. Education is an essential part of living wisely and the Experiences of life, I hope you make it fun.
Learning how to profit in the Stock Market requires time and unfortunately mistakes which are called losses. Why not be profitable while you are learning?
This is the 32th Day course in a series of 60-Days called “Technical Analysis Training“
You will get daily one series of this Training after 8 o’clock night (Dinner Finished)
Follow MoneyMunch.com Technical Analysis Directory and Learn Basic Education of Technical Analysis on the Indian Stock Market (NSE/BSE)
Flag Bullish Chart Pattern
Implication
A Flag (Bearish) is considered a bearish signal, showing that the existing downtrend may continue.
Description
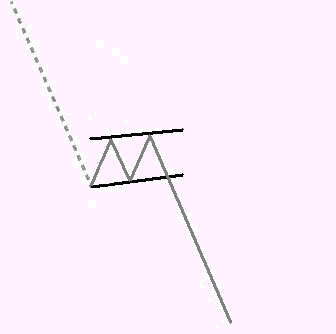
A Flag (Bearish) uses a high, or almost vertical decline in price, and is made up of two synchronous trendlines which kind a rectangular flag structure. The Flag can be horizontal (as though the breeze is blowing it), then again it usually has a minor upward trend.
The vertical downtrend, that precedes a Flag, might take place because of buyers’ side effects to a negative company statement, like as a court case, or a abrupt and unannounced deviation of a CEO. The acute cost decrease is occasionally introduced to as the “flagpole” or “mast”.
The rectangular flag shape is the system of what technical analysts recommend to as combination. Combination happens whenever the price appears to bounce amongst an upper and lower price limitation. The Flag (Bearish) pattern constitution displays the effect of sellers that are prepared to sell at a lower cost, and the increase of buyers who unintentionally drive up the price as they contend to buy at the ideal possible price.
A bearish signal occurs when the price rebounds beyond the lower trendline of the Flag formation, and continues the original downward price movement. This is considered a pattern confirmation.
When speaking about Flags, technical analysts may use jargon and refer to the flag as “flying at half-mast”. Visually, this reference is nothing like a flag at half-mast, such as on a day of national mourning. Instead, this term refers to the location of the flag – at the mid-point of what would otherwise be a continuous downtrend.
Important Characteristics
Following are important characteristics for this pattern.
Trend lines
Flags are too much the same to Pennants. Still, with a Flag, the price trend lines tend to run synchronous, while with a Pennant, the price trend lines tend to border on. John J. Murphy reports that a price fall below the lower trend line may suggest the resumption of the downtrend.
Volume
As the Flag produces, the volume tends to reduce. Still, you will usually observe a acute surge in volume at the end of a Flag, whether it is bearish or bullish.
Duration of the Pattern
Martin Pring records in his book, Technical Analysis described that “Flags can form in a stage as short as 5 days or as longs as 3 to 5 weeks.” John J. Murphy determines that Flags “often previous no longer than one or two weeks.”
Trading Considerations
Possibility of Price Reversal
In some rare situations, the price will break towards the authentic price motion, and produce a reversal trend. The pattern reversal might be signaled during the Flag constitution by a pattern of growing volume, as compared to the additional typical decrease.
Duration of the Pattern
The duration of the pattern is based on the level of the price changes (integration). The better the variations, the longer a pattern will consume to formulate.
Target Price
It is commonly held that the length of the flagpole indicates the potential price decrease. When the Flag completes, the price typically jumps to replicate the height of the original flagpole, while continuing in the direction of the inbound trend.
Criteria that Supports
Volume
Volume must reduce significantly as the pattern forms.
A powerful volume surge on the day of the pattern verification is a powerful signal in support of the possible for this pattern. The volume spike should be importantly preceding the average of the volume for the period of the pattern. In inclusion, the volume over the course of the pattern should be declining on average.
Criteria that Refutes
Duration of the Pattern
Corresponding to Martin Pring, a pattern that surpasses “4 weeks to create should … be managed with careful attention”. After 4 weeks, desire in the stock is probably to reduction to point that it is unexpected to proceed in a powerful downtrend.
No Volume Spike on Breakout
The absence of a volume spike on the day of the pattern ratification is an denotation that this pattern may not be dependable. In inclusion, if the volume has continued frequent, or was improving, over the period of the pattern, therefore this pattern should be regarded less dependable and may in fact reverse.
Long Inbound Trend
Shabacker writes that, “whenever a mast is extended … and it’s Flag fairly small, we should obviously hope the motion to be quite well fatigued when its suggested goal is achieved.” He recommends that when you notice this creation, and a price extension will take place, it is ideal to use the flagpole as a “yard-stick” to show the level at what to “accept profits, move aside, and watch for further chart improvements.”
Underlying Behavior
This pattern is efficiently a intermission in a downtrend. The price has received ahead of itself with a high increase; so market exercise takes a break prior to proceeding the downtrend. This pause is mirrored in the lowering trading volume. Just as, a spike in volume markings the resumption of the downtrend.
Message for you(Trader/Investor): Google has the answers to most all of your questions, after exploring Google if you still have thoughts or questions my Email is open 24/7. Each week you will receive your Course Materials. You can print it and highlight for your Technical Analysis Training.
Wishing you a wonderful learning experience and the continued desire to grow your knowledge. Education is an essential part of living wisely and the Experiences of life, I hope you make it fun.
Learning how to profit in the Stock Market requires time and unfortunately mistakes which are called losses. Why not be profitable while you are learning?
This is the 31th Day course in a series of 60-Days called “Technical Analysis Training”
You will get daily one series of this Training after 8 o’clock night (Dinner Finished)
Follow MoneyMunch.com Technical Analysis Directory and Learn Basic Education of Technical Analysis on the Indian Stock Market (NSE/BSE)
Downside Break Chart Pattern
Implication
A Downside Breakout is regarded a bearish signal, marking a breakout from a trading rate to beginning a new downtrend.
Description
A Downside Breakout happens whenever prices break out from the bottom of a trading range and come down suddenly as a new downtrend forms. It looks that the market is being overloaded with sell instructions. There are generally break inside this activity. This pattern can final for a few days to a few weeks.
Criteria that Supports
Duration of Trading Range
The period of the trading range for that the breakout happened can offer an signal of the energy of the breakout. The longer the timeframe of the trading range the most considerable the breakout.
Narrowness of Trading Range
The “narrowness” of the trading range can also be applied to evaluate the breakout. To determine the narrowness of the trading range contrast the upper bound with the lower bound of the trading rate. If the trading rate has a small difference amongst the upper and lower bound (making it narrow) then the breakout is regarded more powerful and more dependable.
Support and Resistance
Search for a location of support or resistance. A location of price combination or a powerful Support and Resistance Line at or over the target price is a powerful indicator that the price will move to that point.
Moving Average Trend
See at the way of the Moving Average Trend. For small period patterns use a 50 day Moving Average, for extended patterns use a 200 day Moving Average. The Moving Average should modification way during the duration of the pattern and should head in the direction suggested by the pattern.
Volume
A strong volume surge on the day of the pattern ratification is a intense signal in support of the potential for this pattern. The volume surge should be considerably preceding the average of the volume for the period of the pattern. In improvement, the volume during the duration of the pattern must be declining on average.
Criteria that Refutes
Duration of Trading Range
The period of the trading rate for which the breakout happened can supply an signal of the power of the breakout. The reduced the period of the trading range the less important the breakout.
Narrowness of Trading Range
The “narrowness” of the trading range can also be used to gauge the breakout. To decide the narrowness of the trading range evaluate the upper boundary with the lower boundary of the trading range. If the trading range has a large distinction between the upper and lower boundary (making it wide) then the breakout is considered weaker and less dependable.
No Volume Spike on Confirmation
The absence of a volume spike on the day of the pattern verification is an signal that this pattern may not be dependable. In improvement, if the volume has stayed frequent, or was improving, over the duration of the pattern, then this pattern must be regarded less dependable.
Moving Average Trend
Look at the direction of the Moving Average Trend. For short duration patterns use a 50 day Moving Average, for longer patterns use a 200 day Moving Average. A Moving Average that is trending in the opposite direction to that indicated by the pattern is an indication that this pattern is less reliable.
Message for you(Trader/Investor): Google has the answers to most all of your questions, after exploring Google if you still have thoughts or questions my Email is open 24/7. Each week you will receive your Course Materials. You can print it and highlight for your Technical Analysis Training.
Wishing you a wonderful learning experience and the continued desire to grow your knowledge. Education is an essential part of living wisely and the Experiences of life, I hope you make it fun.
Learning how to profit in the Stock Market requires time and unfortunately mistakes which are called losses. Why not be profitable while you are learning?
This is the 18th Day course in a series of 60-Days called “Technical Analysis Training”
You will get daily one series of this Training after 8 o’clock night (Dinner Finished)
Follow MoneyMunch.com Technical Analysis Directory and Learn Basic Education of Technical Analysis on the Indian Stock Market (NSE/BSE)
Double Top Chart Pattern
Implication
A double top occurs when prices form two distinct highs on a chart. A twice top is just complete, however, when rates decline below the lowest low – the “valley floor” – of the structure.
The double top is a rearward design of an climbing pattern in a stock’s rate. Their double top represents an uptrend inside their method of getting to be a downtrend.
Often times known as an “M” constitution since out of the proper layout it generates in the data, the double top is any of the more frequently noticed plus recognized of the layouts. Simply because people surface to be so smooth to determine, the double top must be approached among extreme caution by the trader.
Corresponding to Schabacker, the double top is a “a lot misinterpreted structure.” lots of traders choose that, simply because the double top is actually really a popular layout, this is continuously efficient. This one is not really the issue. Schabacker quotations which most likely not much more compared to a third concerning them indicator rearward and also that more layouts which kind of an trader might possibly call a double top become not in reality that configuration. 2 Bulkowski quotes the double top has a breakdown rate of 65%. If an investor delays for the breakout, conversely, the breakdown rate declines to 17%.
The double top is a pattern, therefore, that requires close study for correct identification.
What does a double top look like?
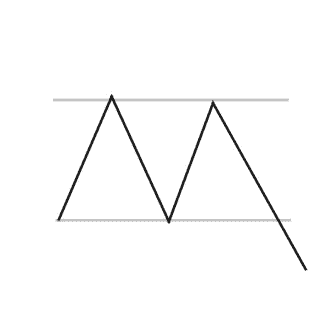
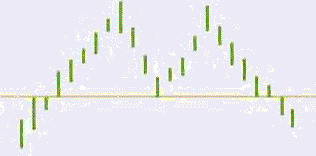
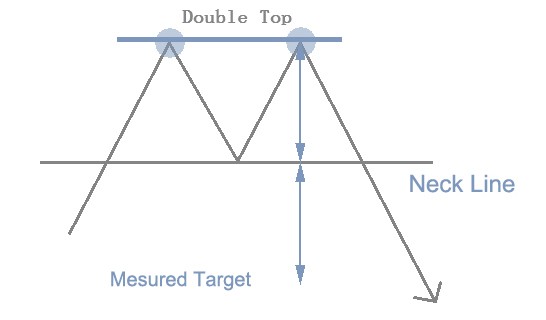
Exclusively as symbolize under, a double top constitutes of two carved, acute highs at roughly the equivalent rate level. A double top provides position whenever rates are in an uptrend. Prices help improve to a complicated process level, escape, come back to the opposition stage once again earlier troubled. The two best want be specific and acute. The design is complete whenever prices decline exclusively under the lowest reduced in the setup. The lowest low is called the verification point.
Corresponding to Black Prince and Magee, there must be at least a 15% decline amongst the two surfaces, on limiting task. The second mass meeting returned to the last high (plus or minus 3%) should be on reduced volume than that the first. Another experts maintain which the descent subscribed amongst the two tops must be at minimum 20% plus the peaks must be separated at least a month separate.
Generally there become a limited details of agreement, then again. Investors must verify which that the design is in reality composed of two specific tops plus which that they must show up nearby the exact same price level. Tops should have a important quantity of time around them all -extending coming from a limited weeks to a year. Traders must maybe not mistake a combination pattern using a dual top. Subsequently, this is critical to the conclusion of the turn around structure which rates nearby just below the verification point.
Why is this pattern important?
Corresponding to Murphy, the double top is one particular of that more continuously noticed as well as many definitely acknowledged. Still, experts recognize that this one can be a difficult design to properly recognize. Investors should spend near consideration to the volume through the constitution of the pattern, the amount of reduction amongst the two peaks, and the instant the framework require to establish on the chart.
A double top often forms in active markets, suffering from heavy trading. A stock’s price minds up rapidly on high volume. Require falls off and price falls, often remaining in a trough for weeks or months. A second run-up in the price occurs taking the price back up to the level achieved by the first top. This time volume is heavy but not as heavy as during the first run-up. Stock prices fall back a second time, unable to pierce the resistance level. These two sharp advances with relatively heavy volume have worn out the buying power in the stock. Without that power behind it, the stock reverses its upward movement and falls into a downward trend.
Is volume important in a double top?
Investors should pay close focus to volume when analyzing a double top.
Commonly, volume in a double top is normally higher on the left top than the right. Volume tends to be downward as the pattern types. Volume does, however, pick up as the design gets its peaks. Volume grows once more when the pattern finishes, breaking through the verification point.
Observation volume is a key factor of identifying regardless or not a double top is legitimate. Schabacker argues that the volume tip must be utilized very strictly in the event of a double top. The first top should be made using significantly high volume. The second top must also knowledge high volume however it require not accomplish the stage of the first top. In reality, Schabacker points out that the second top is always made on just a moderate enhance over the ordinary volume throughout the period between the tops.
Bulkowski describes that volume does not require to be high on the breakout. Whenever a breakout happens using high volume, however, prices tend to decline more.
Elaine Yager, Director of Technical Analysis at Investec Ernst as well as company in New York and a member of Recognia’s Board of Advisors, notes which the right-hand side of the framework is the area to observe most carefully. She observe for decreasing volume until the verification point at which point the volume need increase. However, Yager notes that this pattern is commonly traded with or without the volume increase on the right hand peak.
What are the details that I should pay attention to in the double top?
1. Uptrend Preceding Stock Chart
As said previous, the double top is a reversal enhancement. It starts with costs in an uptrend. Analysts concentrate on particular qualities of that uptrend whenever browsing for a appropriate double top. The trend upwards should be very long and fit. Bulkowski preserves that an investor will need to observe costs trending up more than the short to advanced term – approximately 3 to 6 months. Additional, he says that “the cost trend must not be a reconstruct in an extensive decline however typically has a stair-step appearance. Schabacker verifies this approach, describing that when the stock has been in a long, healthy uptrend, the double top is additional likely to formulate into a reversal. If the uptrend is short, the double top might not maintain and the uptrend will resume.
2. Time between Tops
Analysts spend shut interest to the “size” of the pattern – the period of the interval amongst the two tops. Commonly, the longer the time between the two tops, the most significant the design as a ideal reversal. Schabacker alerts investors off of a pattern in which just a few days interfere between the two peaks. Analysts advise that investors must appearance for patterns where at slightest one month elapses between the peaks. It is not uncommon for a few months to go between the dates of the two tops. Murphy describes that these patterns could duration several years.
On the other side, Yager notes that designs that are very long may be uncontrollable, and she appears for stronger, shorter patterns. Yager considers that shorter patterns are feasible as lengthy as you can see the volume in the right top creating.
3. Decline from First Top
Based on to Schabacker, this component is still additional important to the credibility of a double top compared to volume. He contends the decline in price that happens between the two peaks need be consequential, totalling to around 20% of the price. In concept, he shows that it could still be additional than that but must not be far less. Some other analysts are not so clear or challenging regarding the price decline. For some, such as Yager, a decline of at least 10% is sufficient. All recognize, nevertheless, that the further the trough between the two tops, the best the efficiency of the pattern.
4. Volume As mentioned previously, volume tends to be heaviest during the first peak, lighter on the second. It is common to see volume pick up again at the time of breakout. 5. Decisive Breakout
Corresponding to Murphy, the technical chances normally prefer the continuation of the current trend. It means that it is absolutely ordinary market motion for prices on an uptrend to peak at a immunity level a couple of times, retreat, and then continue that uptrend. It is a obstacle for the analyst to identify whether the decline from a peak is the signal of the improvement of a appropriate double top or plainly a momentary drawback in the evolution of a proceeding uptrend.Analysts, so, suggest mindful investors to hold off for the cost to fall back and break through the verification point prior to depending on the credibility of the pattern. Numerous experts manage that an investor must wait for a important breakout, verified by high volume. Many, like Bulkowski, are not so dependent on high volume at the time of breakout but do accept that the higher the volume at the time of breakout, the further the decline in prices that the pattern will sign up.
6. Pullback after Breakout
A pullback following the breakout is normal for a double top. Bulkowski claims that the higher the volume on the breakout, the higher the chance of a pullback. “Whenever everybody sells their shares soon just after a breakout, what is left is an imbalance of buying requirements (since the sellers have all sold), so the price grows and brings back to the verification point.”
How can I trade this pattern?
Begin by calculating the target price – the lowest anticipated price move. The double top is calculated in a way like to that for the head and shoulders top.
Calculate the height of the pattern by subtracting the lowest low from the highest high in the constitution. Therefore, take off the height of the pattern from the lowest low. In different words, an investor can wish the price to shift downwards at least the distance from the breakout point less the height of the pattern.
For example, assume the lowest low of the double top is 230 and the highest high is 260. The height of the pattern equals 30 (260 – 230 = 30). The minimum target price is 200 (230 – 30 = 200). Given the sometimes weak performance of the double top, Bulkowski suggests dividing the height in half before subtracting from the breakout point. In the above example, this would mean a target price of 215 (230 – 15 = 215). Murphy cautions the term “double top” is greatly overused in the markets. Most of the patterns referred to as double tops are, in fact, something else. Because of this, Murphy advises investors to make their investment decisions only after prices have broken through the confirmation point, completing the reversal pattern.Watching the volume throughout the development of the pattern can help determine whether the pattern is a valid double top. Edwards and Magee explain that patterns where the tops are close together in time are likely not valid double tops but are, in fact, a consolidation area. Generally, analysts like to see deep troughs between the two peaks. Bulkowski advocates a valley that is at least 15% lower than the peaks. Because so many double tops pullback after breaking through the confirmation point, it is often possible to wait for the pullback to place a trade and then watch prices decline for a second time.
Are there variations in the pattern that I should know about?
1. Two Peaks at Different Levels
Often times the two peaks consisting a double top are not at correctly the same price level. This does not really render the pattern incorrect. Murphy points out that investors should be less worried if the second peak does not hit the high of the first peak. If the second peak is higher than the first, still, investors should reveal warning because the pattern may be in the process of starting its uptrend. Analysts suggest that if the second peak surpasses the first by more than 3%, the pattern may not be a double top. At the same time, if the second peak remains higher than the first peak by more than a couple of days, then the pattern may not be a true double top.
Message for you(Trader/Investor): Google has the answers to most all of your questions, after exploring Google if you still have thoughts or questions my Email is open 24/7. Each week you will receive your Course Materials. You can print it and highlight for your Technical Analysis Training.
Wishing you a wonderful learning experience and the continued desire to grow your knowledge. Education is an essential part of living wisely and the Experiences of life, I hope you make it fun.
Learning how to profit in the Stock Market requires time and unfortunately mistakes which are called losses. Why not be profitable while you are learning?
This is the 29th Day course in a series of 60-Days called “Technical Analysis Training”
You will get daily one series of this Training after 8 o’clock night (Dinner Finished)
Follow MoneyMunch.com Technical Analysis Directory and Learn Basic Education of Technical Analysis on the Indian Stock Market (NSE/BSE)
Diamond Top Chart Pattern
Implication
A Diamond Top is considered a bearish signal, indicating a possible reversal of the current uptrend to a new downtrend.
Description
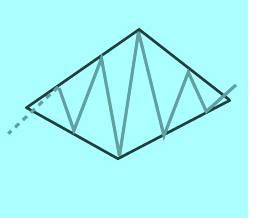
Diamond patterns normally form over several months in very active markets. Volume remains high during the formation of this design. The Diamond Top indicates a reversal to a downtrend.
The Diamond Top pattern occurs because prices create higher highs and lower lows in a broadening design. Then the trading range gradually narrows after the highs peak and the lows start trending upward. The technical event occurs when prices break downward out of the diamond formation
Trading Considerations
Duration of Pattern
Consider the duration of the pattern and its relationship to your trading time horizons. The duration of the pattern is considered to be an indicator of the duration of the influence of this pattern. The longer the pattern the longer it will take for the price to move to its target. The shorter the pattern the sooner the price move. If you are considering a short-term trading opportunity, look for a pattern with a short duration. If you are considering a longer-term trading opportunity, look for a pattern with a longer duration.
Target Price
The target price provides an important indication about the potential price move that this pattern indicates. Consider whether the target price for this pattern is sufficient to provide adequate returns after your costs (such as commissions) have been taken into account. A good rule of thumb is that the target price must indicate a potential return of greater than 5% before a pattern should be considered useful. However you must consider the current price and the volume of shares you intend to trade. Also, check that the target price has not already been achieved.
Inbound Trend
The inbound trend is an important characteristic of the pattern. A shallow inbound trend may indicate a period of consolidation before the price move indicated by the pattern begins. Look for an inbound trend that is longer than the duration of the pattern. A good rule of thumb is that the inbound trend should be at least 2 times the duration of the pattern.
Criteria that Supports
Support and Resistance
Support can be found at the turning point of the lows and resistance at the top peak of the Diamond.
Moving Average
Watch for the 200-day Moving Average to flatten out. Then watch for the 50-day Moving Average to cross below the 200-day Moving Average. This should signal the breakout.
Criteria that Refutes
No Volume
A lack of a volume throughout the pattern is an indication that this pattern may not be reliable.
Short Inbound Trend
An inbound trend that is significantly shorter than the pattern duration is an indication that this pattern should be considered less reliable.
Wishing you a wonderful learning experience and the continued desire to grow your knowledge. Education is an essential part of living wisely and the Experiences of life, I hope you make it fun.
Learning how to profit in the Stock Market requires time and unfortunately mistakes which are called losses. Why not be profitable while you are learning?