
Continue reading
EURUSD moved nicely higher yesterday after the ECB press
 EURUSD went well higher yesterday just after the ECB press meeting that finally sent EURUSD out of the range. Therefore, we consider that Euro will maintain higher within current wave (v) towards 1.3680. When those levels are examined we need to be aware of a bearish reversal in minimum three legs. Depending on Elliott Wave Principle, after every five waves move correction takes place. But break of 1.3500 price level will suggest that in Euro there is already top in place.
To become a subscriber, subscribe to our free newsletter services. Our service is free for all.

Continue reading
Market overview: US unemployment claims below forecasts
 The monthly unemployment report is likely to be a victim of the US government shutdown
1330: Initial weekly US unemployment claims rose by 1,000 to 308,000 in the week ended on September 21st, versus the 315,000 expected by economists.
1320: Vodafone’s CFO will step down from his role of nine years once the sale of its stake in Verizon Wireless completes. The stake, which is being sold for 80bn pounds, is expected to be sold by March 2014. The FTSE has risen 24 points to 6,461.50.
1242: Overnight the Chicago Mercantile Exchange (CME) hiked its margin requirements for operators in the Dow Jones, SP 500 and Nasdaq E-Mini futures contracts by nine per cent. According to Zerohedge that may be a result of President Obama’s remarks to the effect that Wall Street has not yet recognized the seriousness of the current impasse on Capitol Hill.
1120: A little more colour on Aviva, in remarks to Sharecast Ronni Chopra – Head of Strategy at Trade next – pointed out that in the medium-term the stock might still be a potential take-over target. FTSE 100 up 17 to 6,454.
Currency Strength and Central Bank and Gold?
 The crucial story for gold investors is not the pure inflation rate of the dollar, but something much deeper. When you focus on gold, you should sharpen the focus of your lens on the dollar system. As history confirms, gold can both increase and decrease under inflationary circumstances. It is also the case when considering the opposite scenario, which is deflation. It all depends on how well the dollar system is performing (how well is both dollar as a currency and dollar understood as dollar denominated assets; bonds, stocks, derivatives, credits etc.).
The easiest way to look at the dollar is to compare it as a currency against all the other currencies. This, in fact, was the best way to assess the dollar from 2002-3, when it started to lose its value against other currencies and gold began its long and spectacular upward climb. This took place while a bubble formed in dollar denominated assets, especially real estate.
In 2008 there was a radical shift. Shortage of liquidity in the financial markets lead to massive selloffs of assets in all markets, with emerging markets being hit the most. That’s when the dollar got a gust of air in its sails, and increased significantly in value. Under current circumstances, the dollar – as a currency – does not appear to look that bad. Even when compared to other strong currencies, the dollar looks firm. The central bankers who print the British pound and the Japanese yen seem to be devaluation devotees, and the euro is still recoiling from the turmoil of numerous internal problems.
Therefore, when looking purely at the currency markets, the dollar does not appear as endangered as it may seem. However, as we hinted at the beginning, this is not the whole story. We have to assess not only the dollar against other currencies, but the entire dollar system, that is dollar denominated assets. The dollar may be a better investment than the British pound, but the big question is whether gold may be an even better investment than the dollar even when it outperforms the pound.
So how is the dollar system performing internally? One of many possible things to focus on is the interventionist policy of the government, especially the central bank. This can tell us how firmly the economy stands.
In recent years we witnessed tremendous expansion in the Fed’s activity. Since it all comes down to money creation (supplied for financial papers and bonds), this influence is rather negative for the whole dollar system. This means that from the economic point of view, the outlook for gold is quite favorable for the coming years.
Double Bottom Chart Pattern
This is the 27th Day course in a series of 60-Days called “Technical Analysis Training”
You will get daily one series of this Training after 8 o’clock night (Dinner Finished)
Follow MoneyMunch.com Technical Analysis Directory and Learn Basic Education of Technical Analysis on the Indian Stock Market (NSE/BSE)

Double Bottom Chart Pattern
Introduction
A double bottom happens when costs form 2 specific lows on a graph. A double bottom is just accomplish, unfortunately, when costs increase above the maximum end of the point that developed the 2nd low.
The double bottom is a reversal pattern of a downward trend in a stock’s cost. The double bottom markings a downtrend in the procedure of getting an uptrend.
Double bottoms are frequently observed and are regarded to be involving the most typical of the patterns. Considering they appear to be so simple to determine, the double bottom should be approached with caution by the trader.
Based on to Schabacker, the double bottom is a “much misunderstood formation.” Many individuals consider that, because the double bottom is such a common pattern, it is constantly dependable. This is not the case. Bulkowski estimates the double bottom has a failure rate of 64%, which he terms amazingly high.If an trader waits for a appropriate breakout, however, the inability level decreases to 3%. The double bottom is a pattern, therefore, that needs close study for ideal identification.
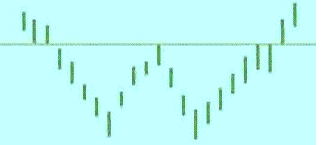
What does a double bottom look like?
As observed under, a double bottom consists of 2 well-defined lows at near the similar amount. Cost decrease to a maintain level, rally and pull back up, then fall to the support level again before enhancing.
Why is this pattern important?
Corresponding to Murphy, the double bottom is one of the most commonly seen and most easily identified. Still experts concur that this can be a complicated structure to effectively identify. Traders must spend close interest to the amount through the enhancement of the pattern, the amount of increase between the two lows, and the time the pattern takes to develop on the chart.
Murphy describes that bottoming patterns may have compact amount distances than topping patterns and often take longer to build. “For this reason, it is usually easier and less costly to identify and trade bottoms than to catch market tops.”
Is volume important in a double bottom?
Traders should purchase close focus to quantity when studying a double bottom.
Usually, amount in a double bottom is commonly increased on the left bottom than the right. Volume tends to be downward as the pattern forms. Volume does, however, pick up as the pattern hits its lows. Volume increases again when the pattern completes, breaking through the verification point.
Tracking amount is a key feature of identifying perhaps or not a double bottom is legal.
What are the details that I should pay attention to in the double bottom?
1. Downtrend Preceding Double Bottom
As discussed earlier, the double bottom is a reversal development. It commences with costs in a downtrend. Bulkowski cautions that on specific way down, cost should not move under the left low of the structure.
2. Time between Bottoms
Experts spend close focus to the “size” of the structure – the timeframe of the time interval amongst the 2 lows. Commonly, the lengthy the duration amongst the 2 lows, the more significant the pattern as a ideal reversal. approximately 3 months apart.
3. Increase from First Low
Many experts claim the enhance in cost that happens amongst the 2 soles should be consequential, amounting to near 20% of the amount. Another experts are not so certain or requiring concerning the cost enhance. For some, an enhance of at least 10% is sufficient. Yager definitely agrees with this point. The rise between the lows tends to look spherical but it can also be erratic in structure.
4. Volume
As described previously, amount tends to be heaviest through the 1st low, lighter on the 2nd. It is typical to see amount pick up again at the time of breakout.
5. Decisive Breakout
Corresponding to Murphy, the specialized probabilities generally approval the extension of the introduce trend.This indicates that it is absolutely normal market motion for prices on a downtrend to fall to a maintain stage a number of days, increase back up, and then resume that downtrend. It is a dare for the expert to identify perhaps the increase from the bottom is the indication of the improvement of a legitimate double bottom or basically a short-term problem in the development of a constant
6. Pullback after Breakout
A pullback after the breakout is normal for a double bottom. Bulkowski reports that in 68% of double bottom patterns, amount will throwback to the breakout amount.
How can I trade this pattern?
Get started by estimating the desired cost -of the minimum required price move. The double bottom is calculated in a way similar to that for the head and shoulders bottom.
Estimate the level of the pattern by subtracting the lowest low from the highest high in the enhancement. Then, include the level of the pattern to the highest high. In other words, an investor can expect the cost to move upwards at least the distance from the breakout point plus the height of the pattern.
For example, assume the lowest low of the double bottom is 220 and the highest high is 290. The height of the pattern equals 70 (290 – 220 = 70). The minimum target price is 360 (290 + 70 = 360).
Murphy cautions the terms “double tops and bottoms” are greatly overused in the markets. Most of the patterns referred to as double bottoms are, in fact, something else. Because of this, Murphy advises investors to make their investment decisions only after prices have broken through the confirmation point, completing the reversal pattern.Watching the volume throughout the development of the pattern can help determine whether the pattern is a valid double bottom.
Yager notes that the key for this pattern is for the investor to have patience and wait for confirmation. Too often investors see double bottoms everywhere.
Edwards and Magee explain that patterns where the bottoms are close together in time are likely not valid double bottoms but are, in fact, a consolidation area.
Because so many double bottoms pullback after breaking through the confirmation point, it is often possible to wait for the pullback to place a trade and then watch prices decline for a second time. Bulkowski estimates that the average time for prices to return to the breakout price is 11 days. Throwbacks that occur 30 days after the breakout are not throwbacks at all, but simply normal price fluctuations.
Message for you(Trader/Investor): Google has the answers to most all of your questions, after exploring Google if you still have thoughts or questions my Email is open 24/7. Each week you will receive your Course Materials. You can print it and highlight for your Technical Analysis Training.
Wishing you a wonderful learning experience and the continued desire to grow your knowledge. Education is an essential part of living wisely and the Experiences of life, I hope you make it fun.
Learning how to profit in the Stock Market requires time and unfortunately mistakes which are called losses. Why not be profitable while you are learning?
Continue reading
Diamond Bottom Chart Pattern
This is the 44th Day course in a series of 60-Days called “Technical Analysis Training”
You will get daily one series of this Training after 8 o’clock night (Dinner Finished)
Follow MoneyMunch.com Technical Analysis Directory and Learn Basic Education of Technical Analysis on the Indian Stock Market (NSE/BSE)
Diamond Bottom Chart Pattern
Implication
A Diamond Bottom is considered a bullish indication, indicating a opportunities reversal of the established downtrend to a better uptrend.
Description
Diamond patterns generally form over varied months in very effective markets. Quantity remains high through the enhancement of this pattern.
The Diamond Bottom pattern happens considering costs produce greater levels and less lows in a widening structure. Then the investing range progressively narrows after the heights peak and the lows start trending ascending. The Technical Analysis happens when prices break upward out of the diamond enhancement.
 Trading Considerations
Duration of Pattern
Think about the timeframe of the structure and its connection to your investing time perspectives. The timeframe of the structure is regarded to be an indication of the timeframe of the impact of this pattern. The extended the structure the extended it will consider for the cost to move to its target.
Target Price
The target price produces an significant indication about the potential price move that this pattern indicates. Consider whether the target price for this pattern is sufficient to provide adequate returns after your costs (such as commissions) have been taken into account. A good rule of thumb is that the target price must indicate a potential return of greater than 5% before a pattern should be considered useful. However you must consider the current price and the volume of shares you intend to trade. Also, check that the target price has not already been achieved. intraption
Inbound Trend
The inbound tendency is an significant characteristic of the pattern. A superficial inbound tendency may suggest a stage of combination before the amount move suggested by the pattern begins. Look for an incoming development that is extended than the period of the pattern. A good rule of thumb is that the incoming tendency should be at least two occasions the period of the structure.
Criteria that Supports
Support and Resistance
Maintain can possibly discovered at the switching point of the lows and opposition at the top maximum of the Diamond.
Moving Average
Observe for the 200-day Moving Average to trim out. Subsequently observe for the 50-day Moving Average to corner above the 200-day Moving Average. This should indication the breakout.
Criteria that Refutes
No Volume
A absence of a quantity during the structure is an signal that this structure may not be dependable.
Short Inbound Trend
An incoming tendency that is considerably smaller than the structure timeframe is an indicator that this structure should be regarded less dependable.
Wishing you a wonderful learning experience and the continued desire to grow your knowledge. Education is an essential part of living wisely and the Experiences of life, I hope you make it fun.
Learning how to profit in the Stock Market requires time and unfortunately mistakes which are called losses. Why not be profitable while you are learning?
Continue reading