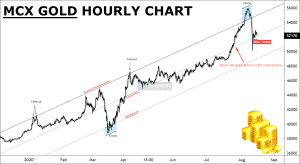
Update: Is Gold Price Setting Up for an Uptrend?
Have you read the August 16th newsletter of Gold?
If not, click here.
I have written, “Don’t forget to follow the control price (CP). If gold breakdown CP, it may fall for 51360 – 51000 – 50500 – 50000 levels. Watch out the selling level on the chart.”
Yesterday gold has touched all targets. To become a subscriber, subscribe to our free newsletter services. Our service is free for all.
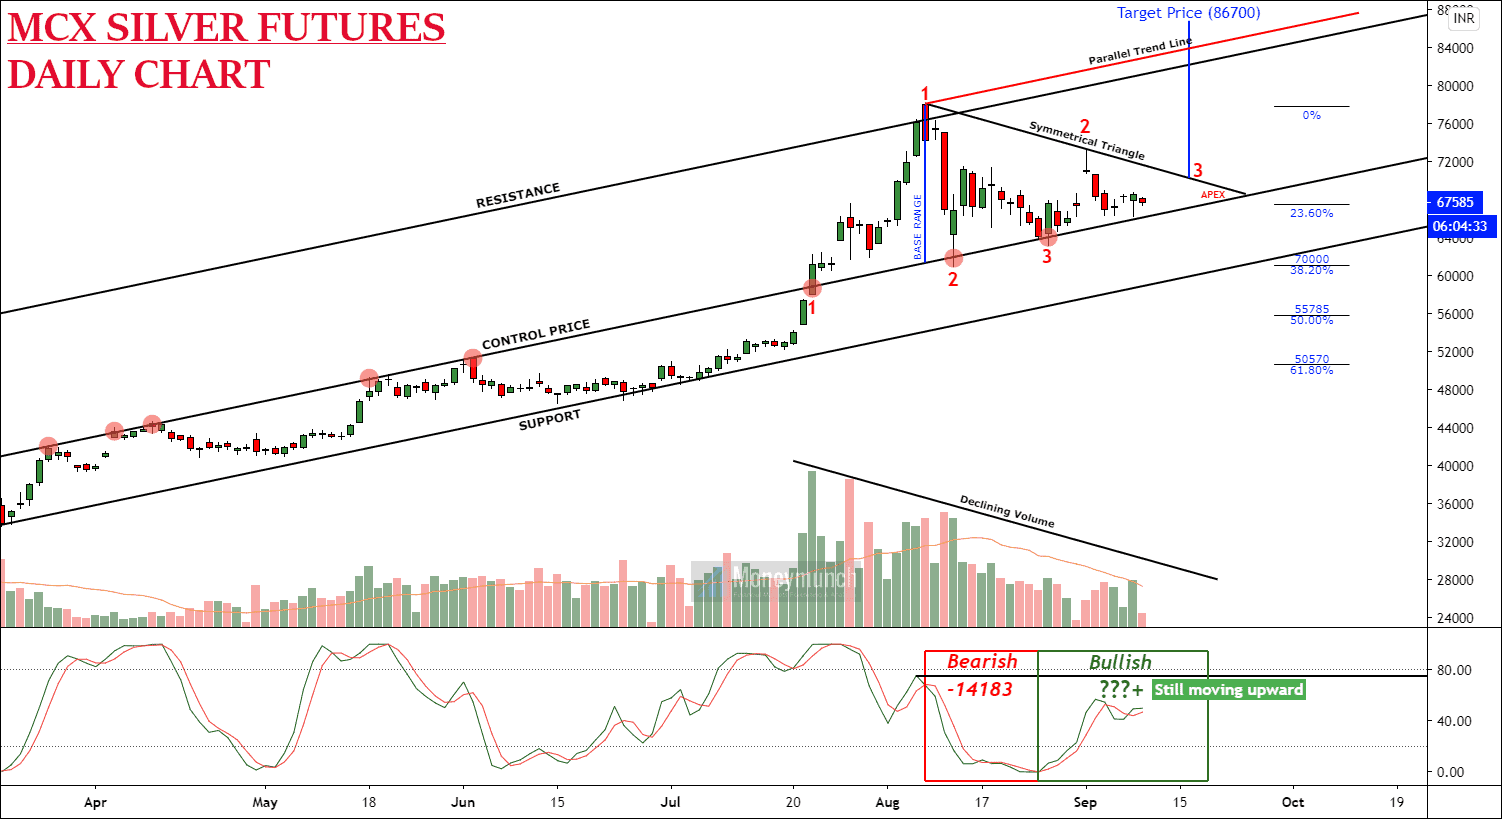
Is silver ready for the second target?
 Did you read the September 9th article of Silver?
Click here to read now
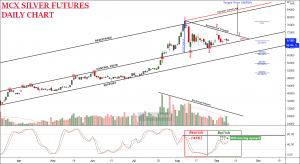
I have written in bold words, “…if you look at the volume and S RSI indicators, it is planning for a downtrend. And at present, silver is very close to the control price line. Hence, a downtrend may start from this point. A breakdown of control price can initiate a new fall for 61000 – 55785 – 50570 levels.”.
So, yesterday silver has touched the first target. If it remains under the retracement level of 38.20%, we may see continue downfall.
If it remains under the 38.20% retracement level, it will keep falling for the next target.
Please note that silver playing at March 2020 uptrend channel (support). Hence, don’t sell above it, Because it will start to rise from there up to 23.60% (67445).
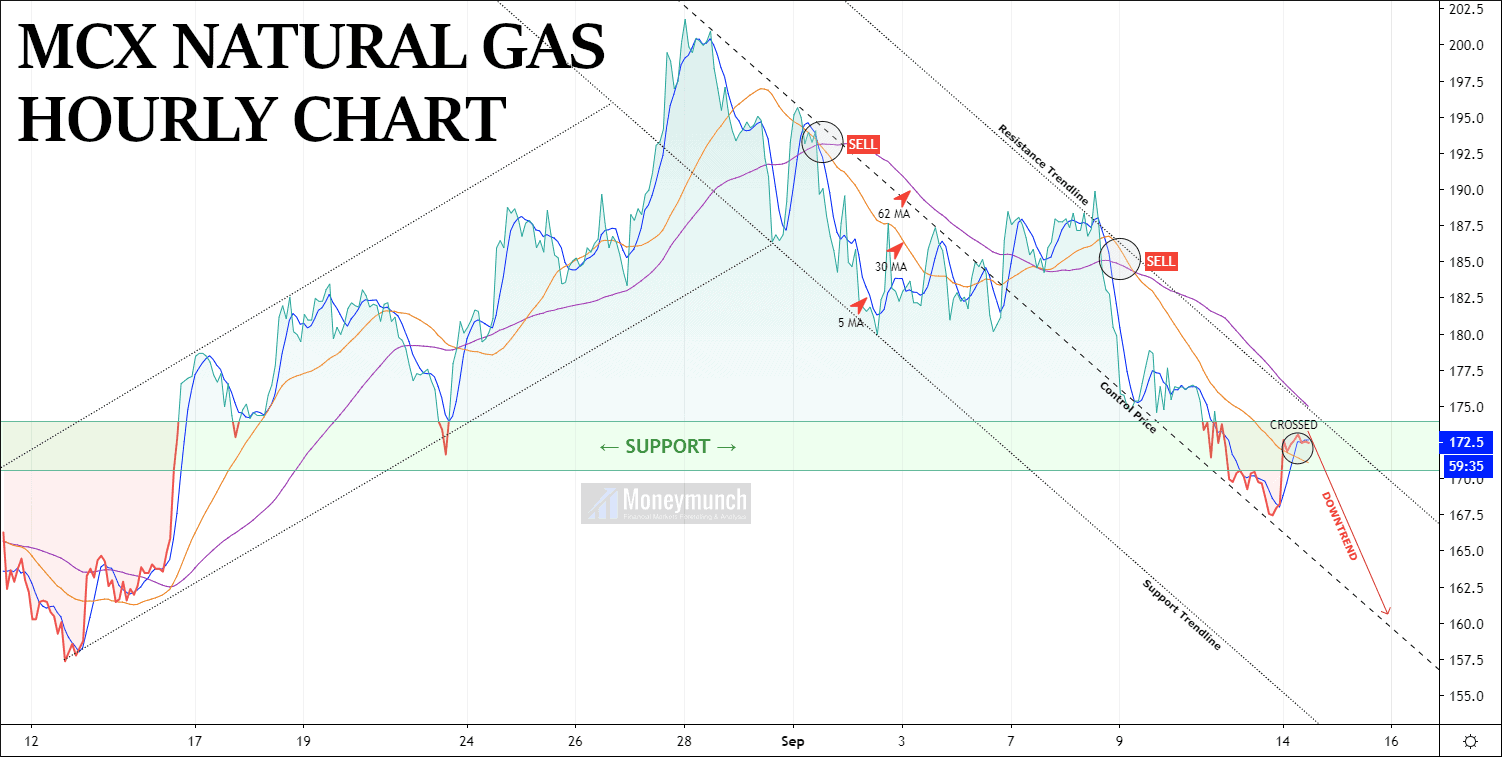
Update: Natural gas Struggling at Strong Support

Have you read the natural gas intraday tips report?
Click here to read it now
I have written, “for safe traders, short positions can be initiated after 170 levels.
Targets: 167.6 – 165 – 162.6 – 160“.
Natural gas has touched all targets as well. What else you want?
The next report about MCX base metals commodities (Aluminum, Copper, & Nickel) is coming soon. Stay connected!