To become a subscriber, subscribe to our free newsletter services. Our service is free for all.
Continue reading
To become a subscriber, subscribe to our free newsletter services. Our service is free for all.
First, click here and get the details of the free nickel’s call details.
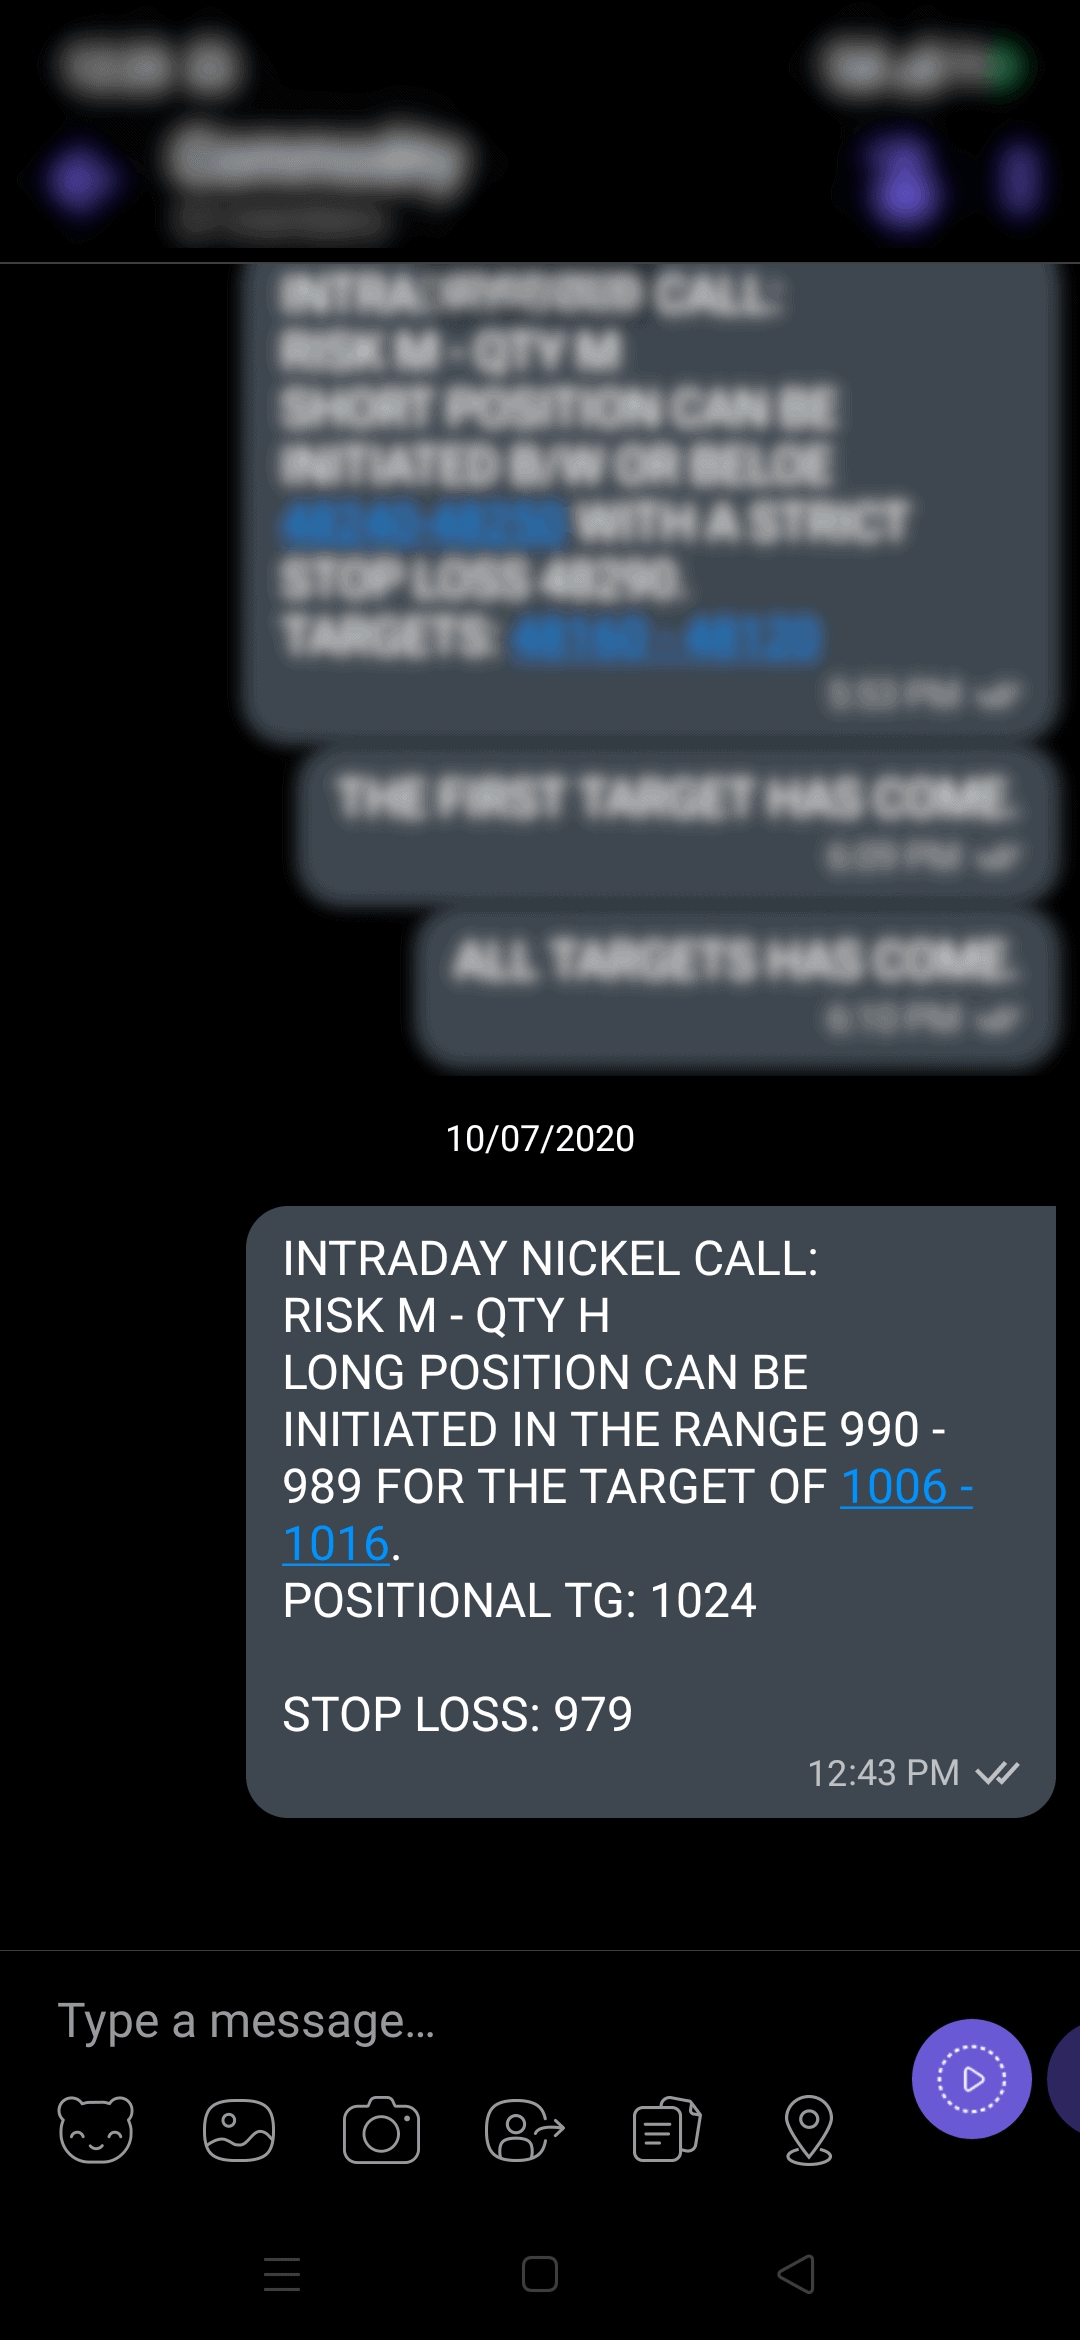
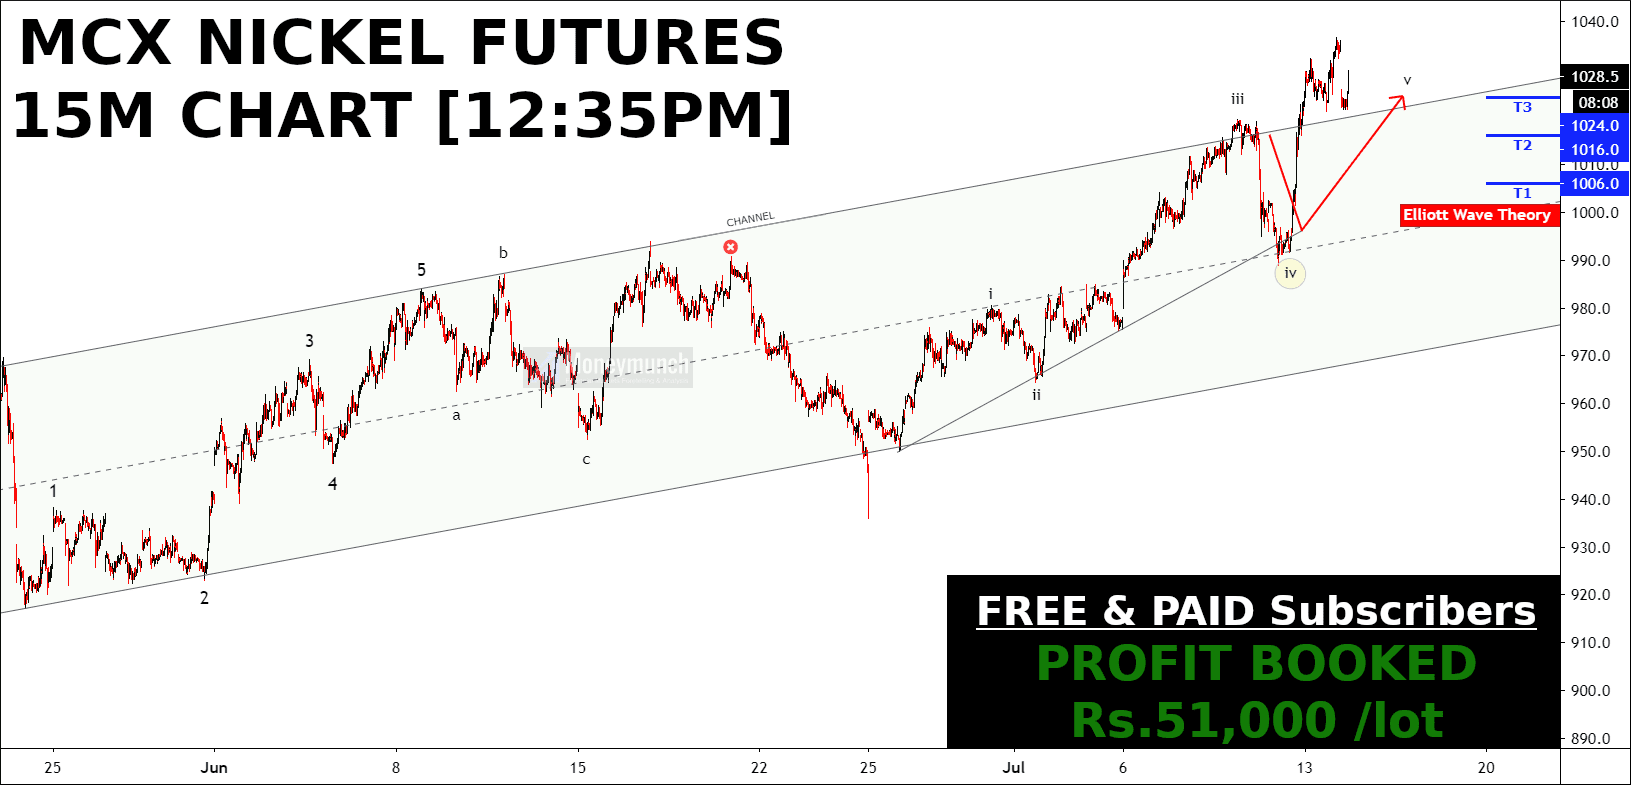
How many of you traded on free Nickel tips? It has already touched all targets.
PROFIT Per Lot: Rs.51,000
What else you want.!?To become a subscriber, subscribe to our free newsletter services. Our service is free for all.

Bajaj Finance has already formed a descending triangle
It has break its triangle in up-direction and now this stock is following an up-direction.
You can see in the chart I have mentioned “continues up-move”
after every continues up move, the stock always form a small triangle and there is a price rotation.
The stock has taken perfectly it’s support every-time.
To become a subscriber, subscribe to our free newsletter services. Our service is free for all.

The stock is trading near the support of curve line.
It has already formed a M-top pattern that is double top.
The stock is trading in between 100 and 90 price.
To become a subscriber, subscribe to our free newsletter services. Our service is free for all.
To become a subscriber, subscribe to our free newsletter services. Our service is free for all.
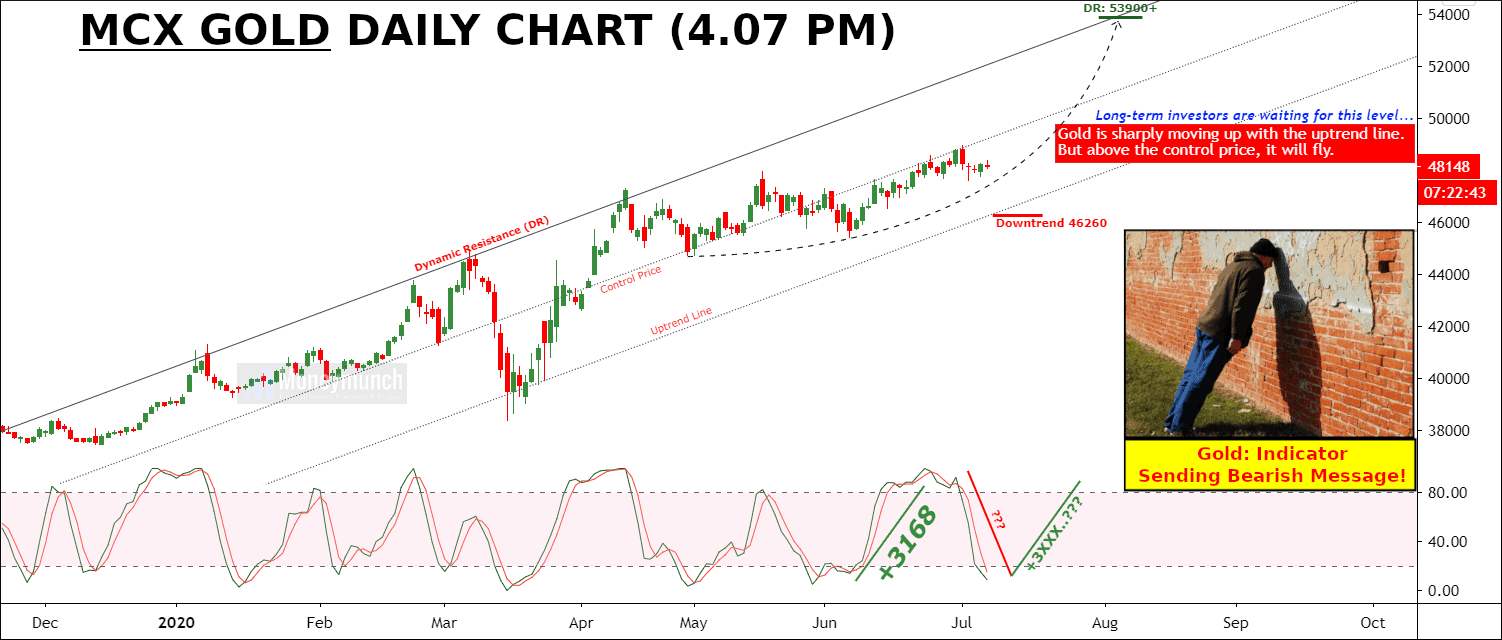
As per the chart above, gold is trying to take a U-Turn. It can slip for 47460 – 46760 – 46260 levels.
As per the S-RSI, it will start running upside soon for the dynamic resistance level of 53900. Hence, targets: 49560 – 50000 – 52000 – 53000+
Don’t forget to keep your eyes on downtrend level 46260.
To become a subscriber, subscribe to our free newsletter services. Our service is free for all.
 Unlock This Article