Precious seen AB=CD pattern on LUPIN. The “B” retraced at exact 61.8% and BC project at accurately 1.168%. After completing this pattern, extreme fall was seen in the price. —————————————————————————————————– Bullish Butterfly pattern required “B” mid-point 78.6% retracement and The price can fall 1.27.
The reversal can push the price to previous level first 938 and 980.
The price a rise near of the range 853 and 846.
To become a subscriber, subscribe to our free newsletter services. Our service is free for all.
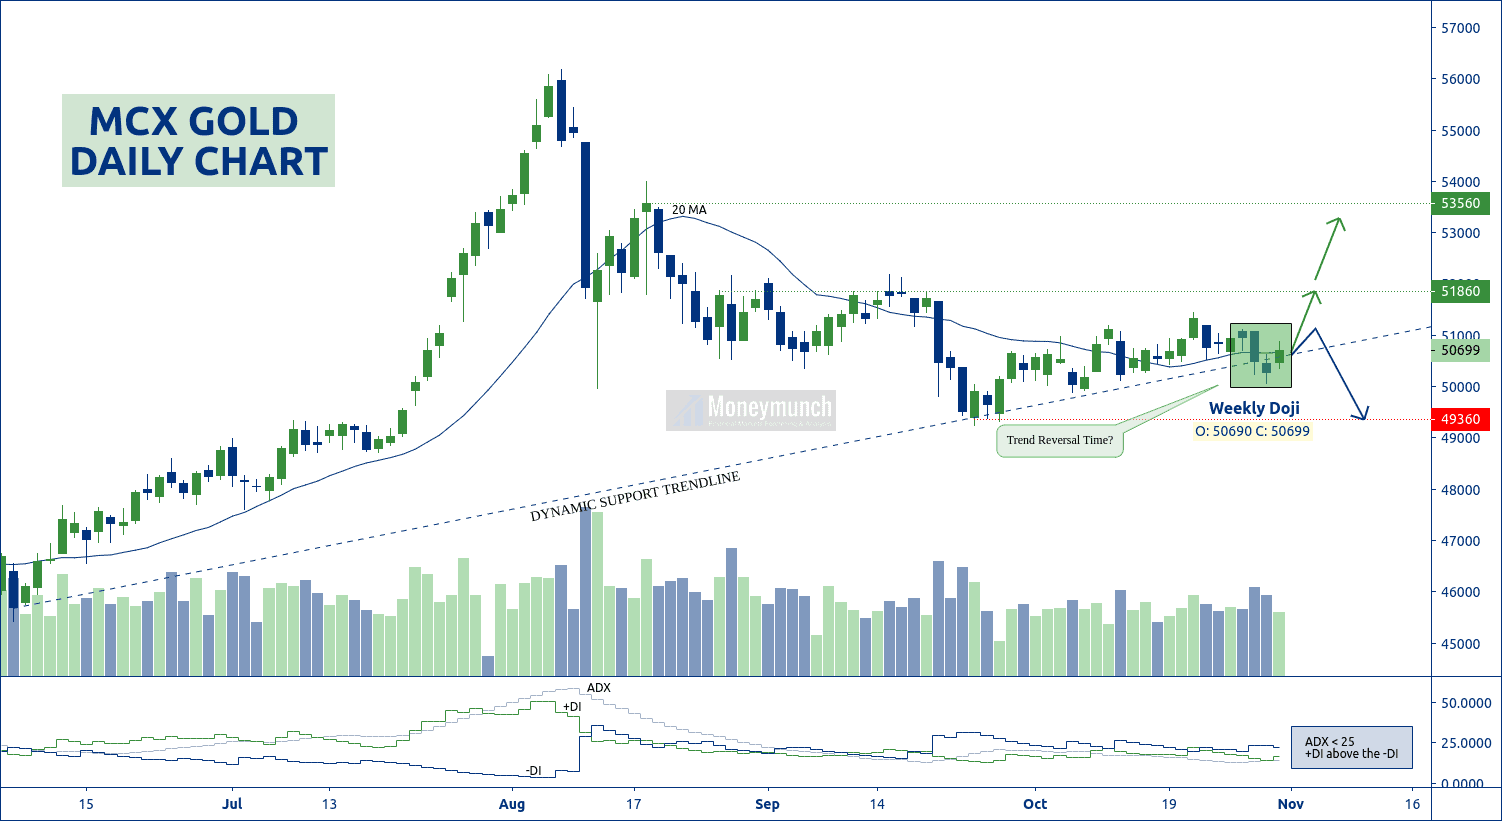
Gold has made a Doji in the weekly chart. It’s a direct sign of a reversal. And wherein ADX is less than 25 but +DI above the -DI. Additionally, the 20 MA line is trying to stay downside.
In short, DMI & MA is throwing a strong upward signal. Moreover, its volume is increasing. This week, we have chances to see gold prices above the 51860 levels. The day traders can follow the following targets: 51000 – 51360 – 51860+
And short-term investors can hold for 52000 – 53000 – 53560+ levels.
All you need to do is watch out for a dynamic support trendline. It should remain above it. Else, it will start falling. And that downfall for the levels of 50000 – 49600 – 49360.
Significant releases or events that may affect the movement of gold & crude oil: Monday, Nov 02, 2020
11:00 – Gold Index
Tuesday, Nov 03, 2020
05:30 – U.S. Presidential Election
Wednesday, Nov 04, 2020
02:00 – U.S. API Weekly Crude Stock
21:00 – U.S. Crude Oil Inventories
Crude Oil Price Setting Up For A Downside Price Rotation
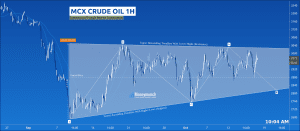
First, let’s talk about the previous update of crude oil . There, I have drawn the symmetrical triangle bearish pattern on the hourly chart of MCX’s crude oil.
I had written for the day traders, “…the last expected stop is at E. So, we may see crude oil at/below 2840 – 2820 level”.
THESE TARGETS HAS REACHED.
And for the short-term traders, I had written in bold words, “this symmetrical triangle base range is 378 points. So, the game will begin whenever crude oil will break out the triangle pattern . Downward breakout’s targets: 2610 – 2500 – 2460“.
Crude oil has touched the first target (2610) by making a low of 2606 level on 29 Oct ’20. Now let’s come to the point, will crude hit the second & last target or not?
CRUDE OIL DOWNSIDE BREAKOUT ALERT! If crude oil prices break out the 2600 level, we will see 2540 – 2500 – 2460 levels before the weekend.
Please note that don’t sell it above the 2600 level.
To become a subscriber, subscribe to our free newsletter services. Our service is free for all.
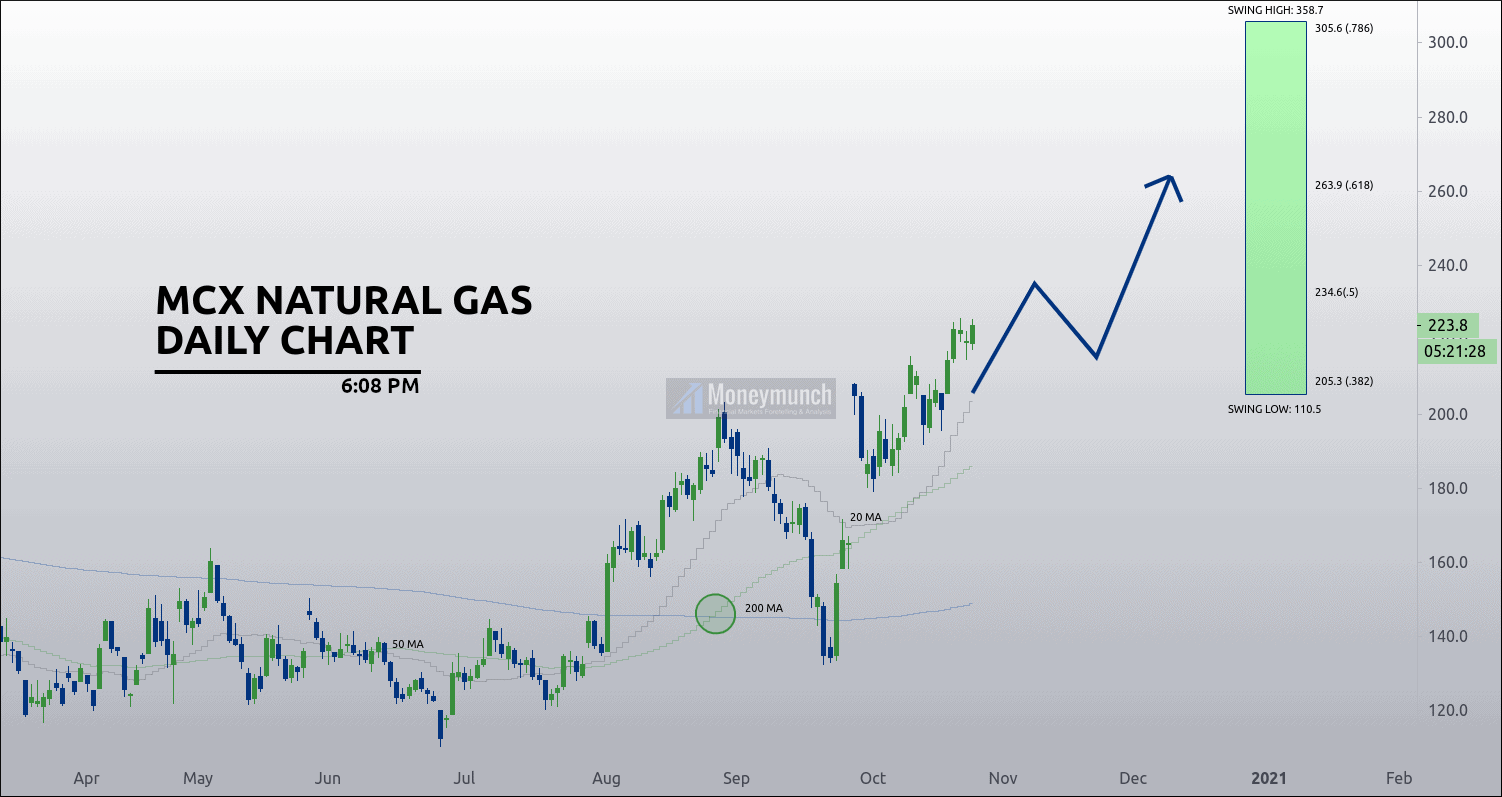
It is near the main support line and likely to take its support and move up direction. At the current level there is two support acting, 1st main support and 2nd symmetrical triangle ascending lower trend, so it has a strong support. In the past it had already made a symmetrical triangle and was so accurate the price target was perfectly followed, so it is concluded that that price will follow its support and move up, The triangle itself is neutral, it still favors the direction of the existing trend and traders look for breakouts in the direction of the trend. BUY ZONE -128-123 STOP-LOSS -119 TARGET -163
To become a subscriber, subscribe to our free newsletter services. Our service is free for all.
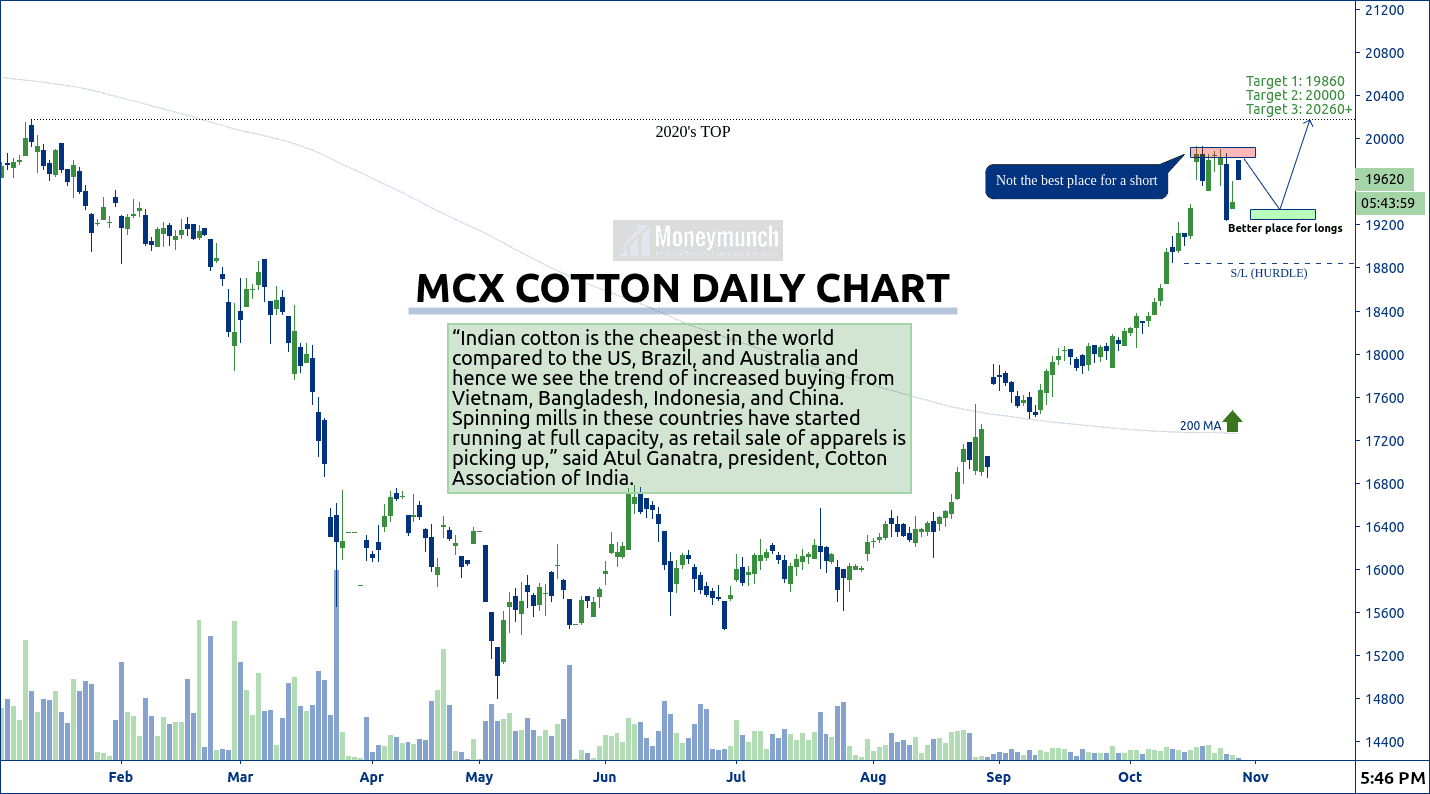
According to fundamental research, MCX (NCDEX) cotton seems strongly bullish ahead. The short-term investors can start buying cotton nearby highlighted area for the targets of 19860 – 20000 – 20260+.
To become a subscriber, subscribe to our free newsletter services. Our service is free for all.