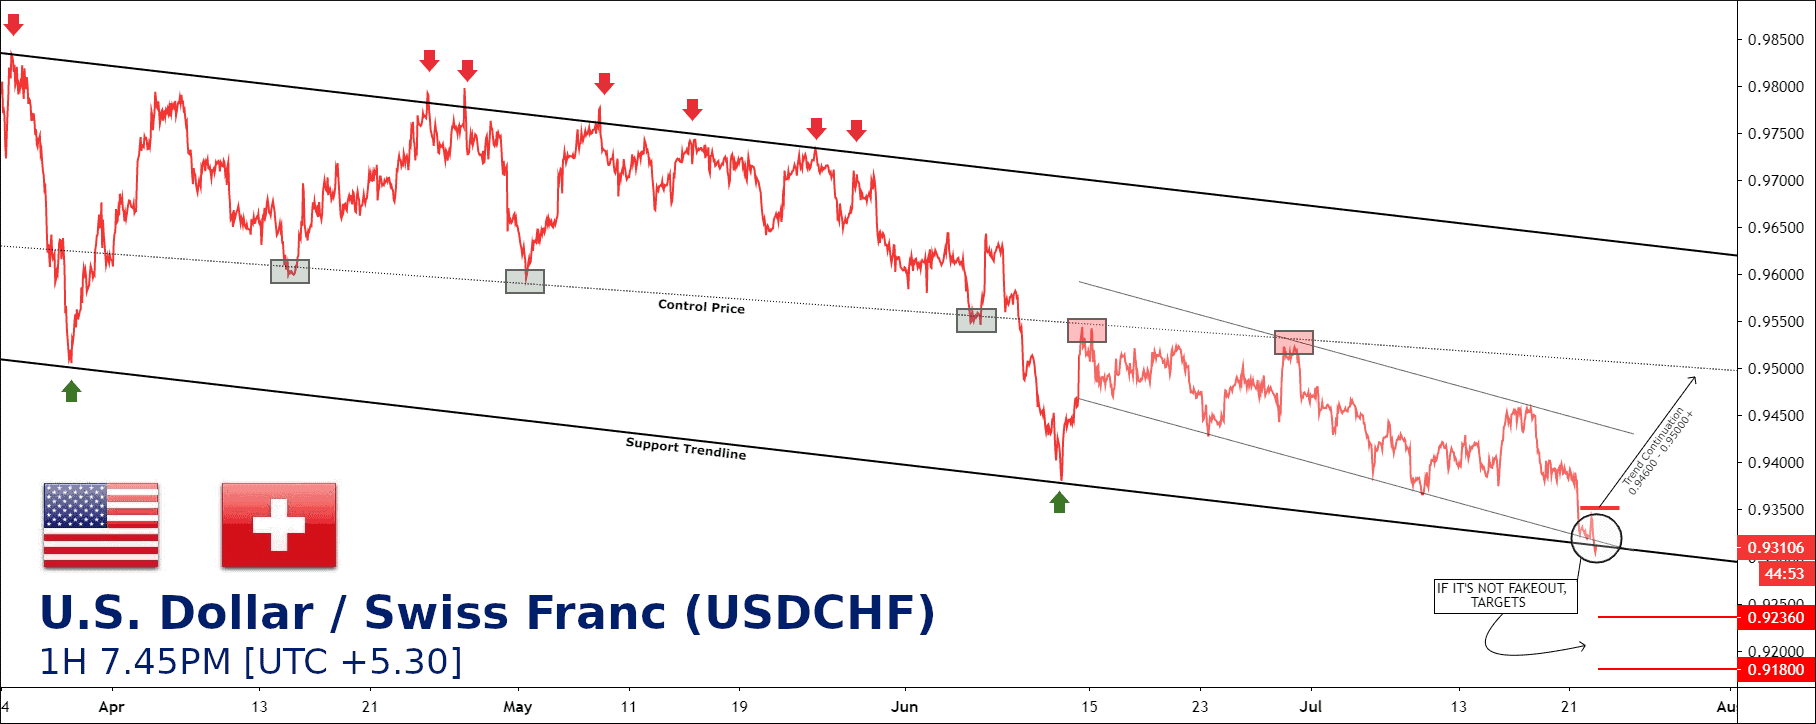
As per this chart, the trend continuation will drag up to 9.94600 – 0.95000 levels.
Keep your eyes on the support trend line, USDCHF has broken it. If it’s not fake-out, 0.92360 – 0.91800 target levels.
Continue reading
As per this chart, the trend continuation will drag up to 9.94600 – 0.95000 levels.
Keep your eyes on the support trend line, USDCHF has broken it. If it’s not fake-out, 0.92360 – 0.91800 target levels.

JUBLFOOD momentum is a good, it is trading in a middle of the disjoint channel.
At every support and resistance, it generally creates a tail.
After it takes its support and resistance the “falling and moving up” that momentum is great, and after taking support and resistance the stock has a minimum of 100 point moves.
As the stock is trading in the middle of a disjoint channel, it can oscillate between 1686 to 1774.
To become a subscriber, subscribe to our free newsletter services. Our service is free for all.
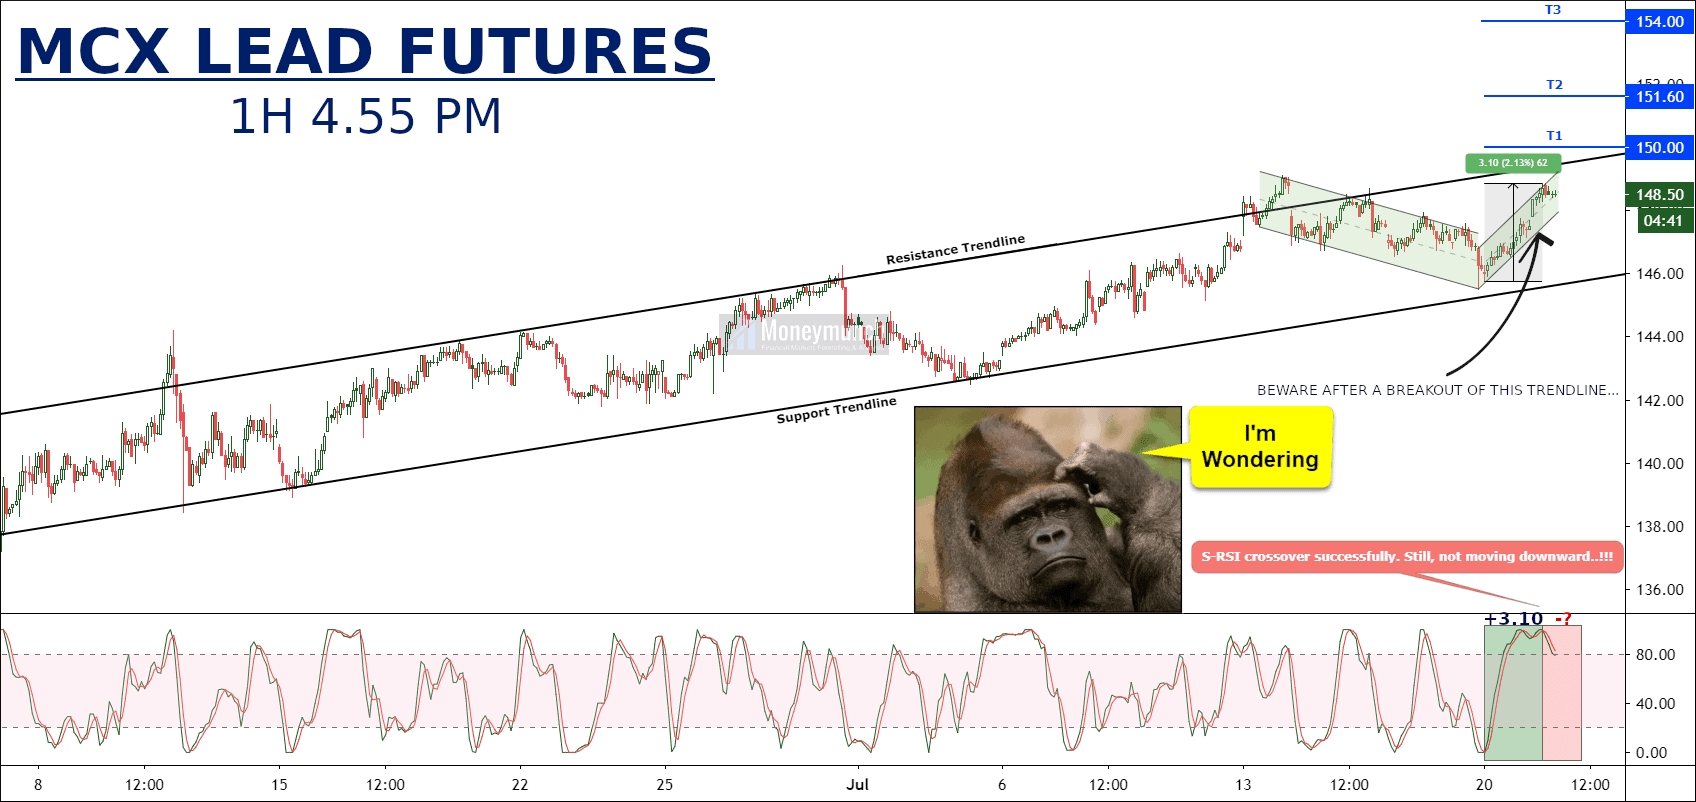
As per this MCX Lead chart, it’s trying to march upward. We may see T1 to T3 soon. Further information I will update you soon.
UPDATE: Gold & Copper Overall Outlook Is ‘Strongly Bullish’
Yesterday’s Chart:
Today:
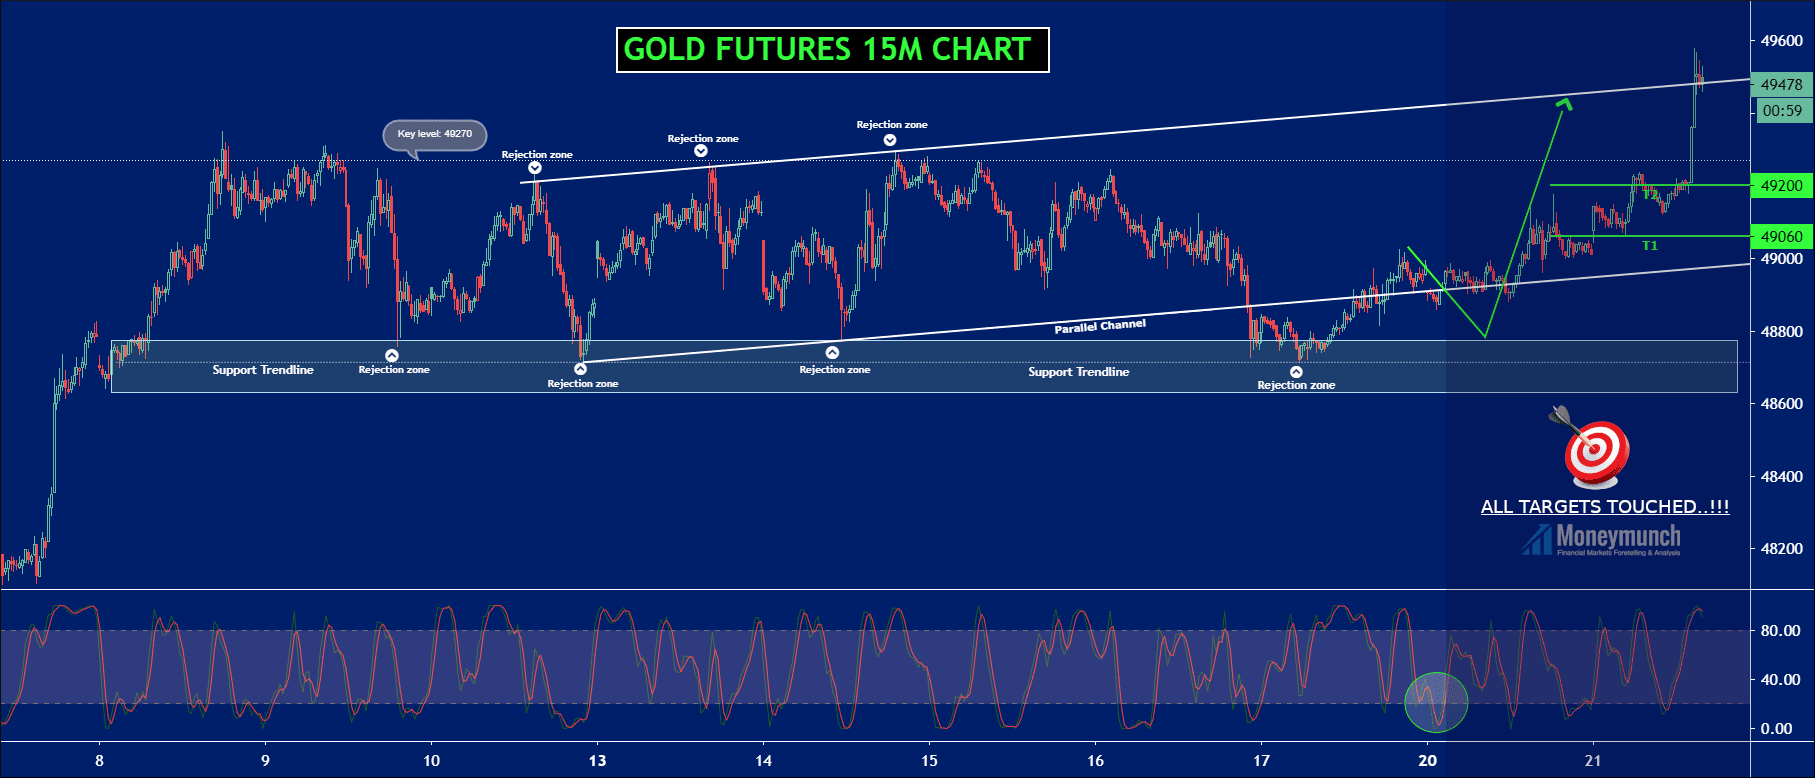
Gold call hit all targets level. Moreover, it has touched the key level within 24 hours. To become a subscriber, subscribe to our free newsletter services. Our service is free for all.
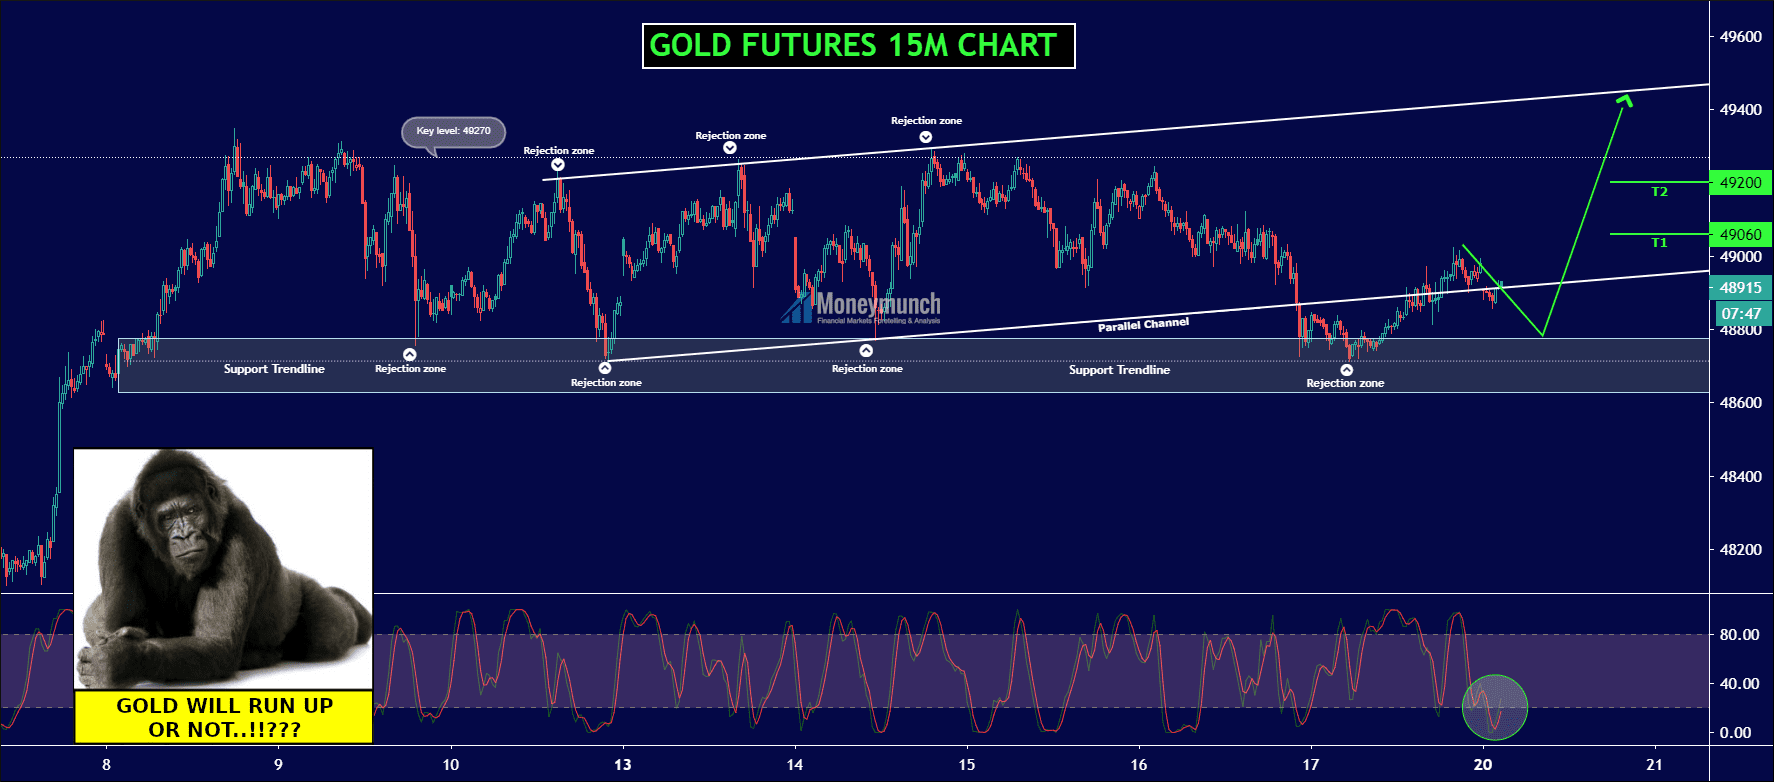
After a short reversal, gold will start marching for 49060 – 49200. Don’t mess with gold below support trendline.
Can we expect a key level as a target? Yes, and I will update it into the next newsletter.
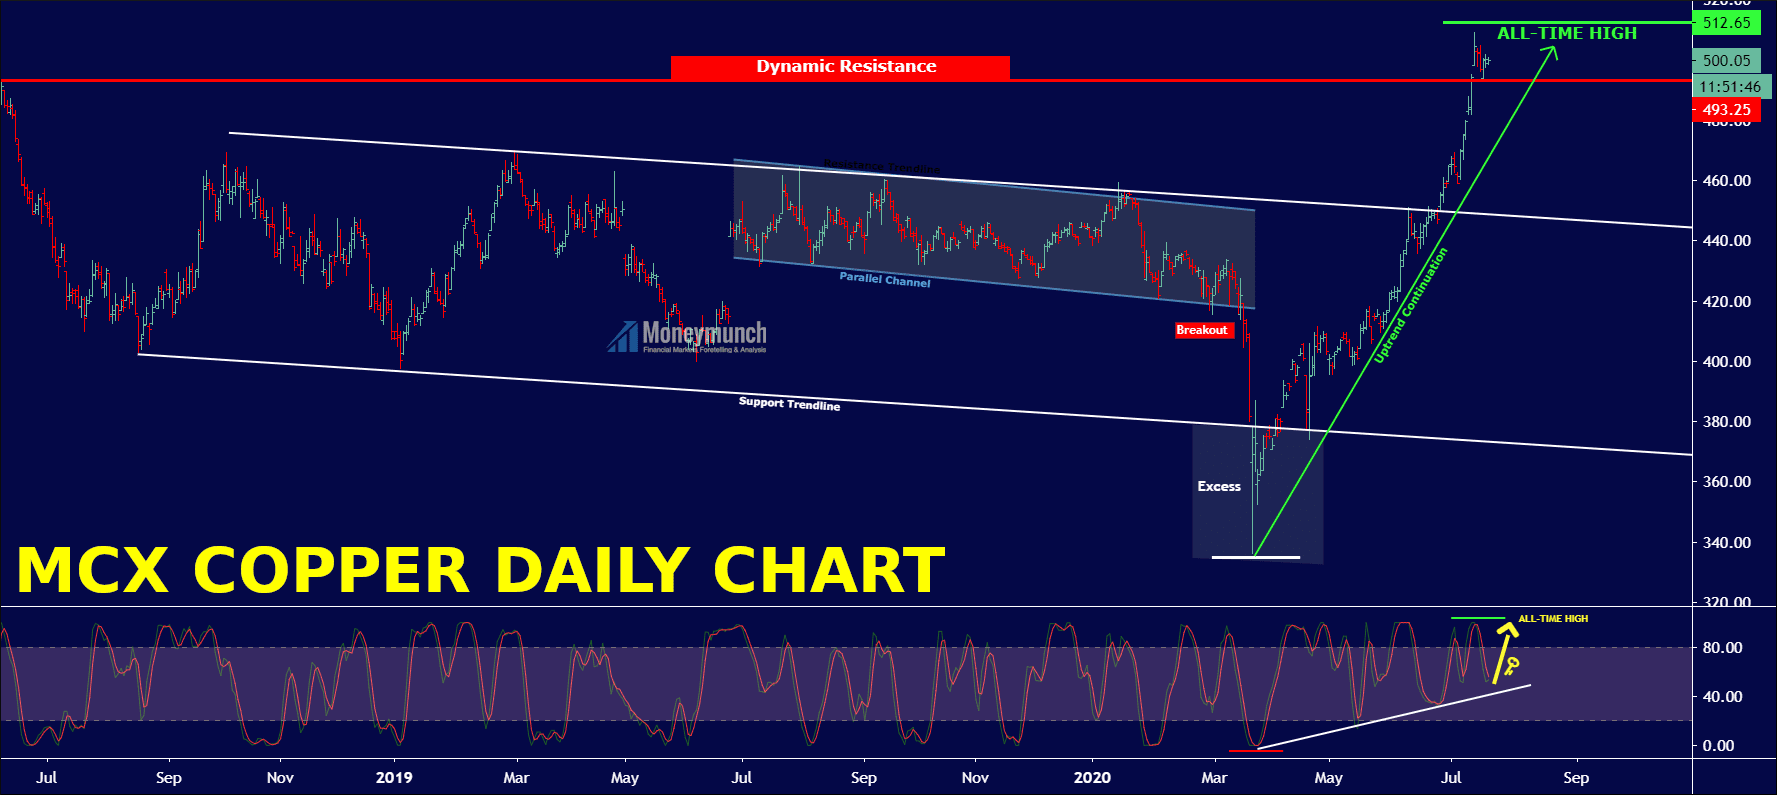
Copper has made a high of 509.25 and took U-turnWe may see at all-time high soon.
S-RSI is a key to take an entry.
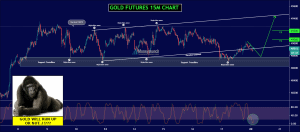
Black Gold will explode soon. Read the previous report here: Crude Oil Trading Strategy & Calls
To become a subscriber, subscribe to our free newsletter services. Our service is free for all.

In daily chart stock had already broken its resistance and overall the stock is in bullish form.
It can be considered that the stock will oscillate in this price.

In smaller time frame one hour chart the stock movement is slow, but it is in the bullish form. So by keeping support level that is 1853 buy and stop-loss can be 10 point lower the support. Target can be near 1978.
To become a subscriber, subscribe to our free newsletter services. Our service is free for all.
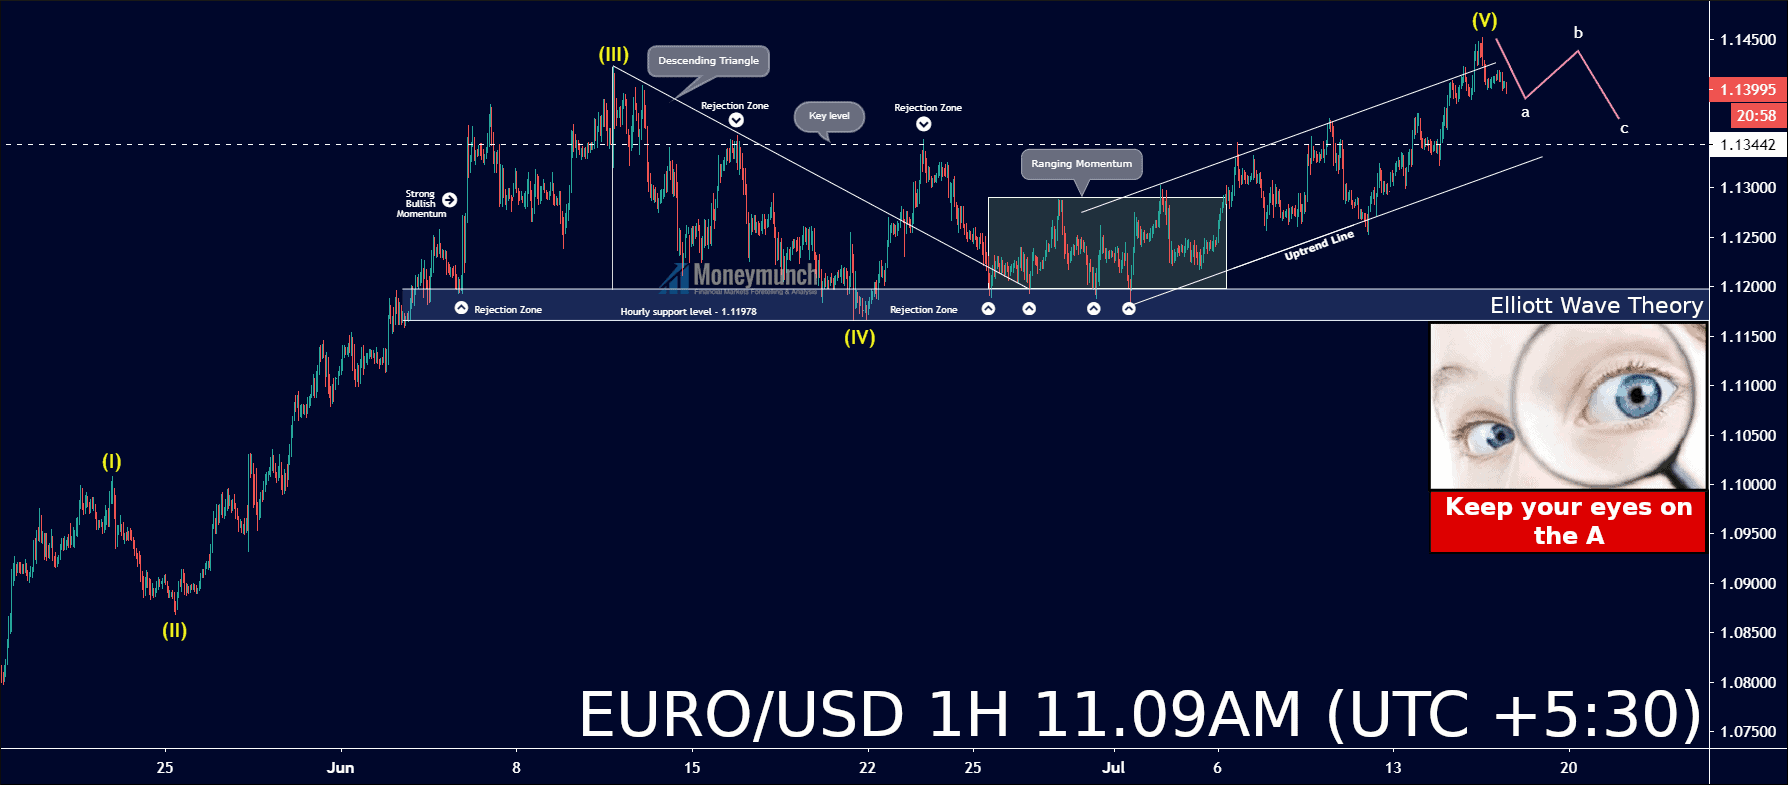
As per this chart, EUR/USD starts marching for B (1.1426 level).
Next move (C): 1.1370 level.