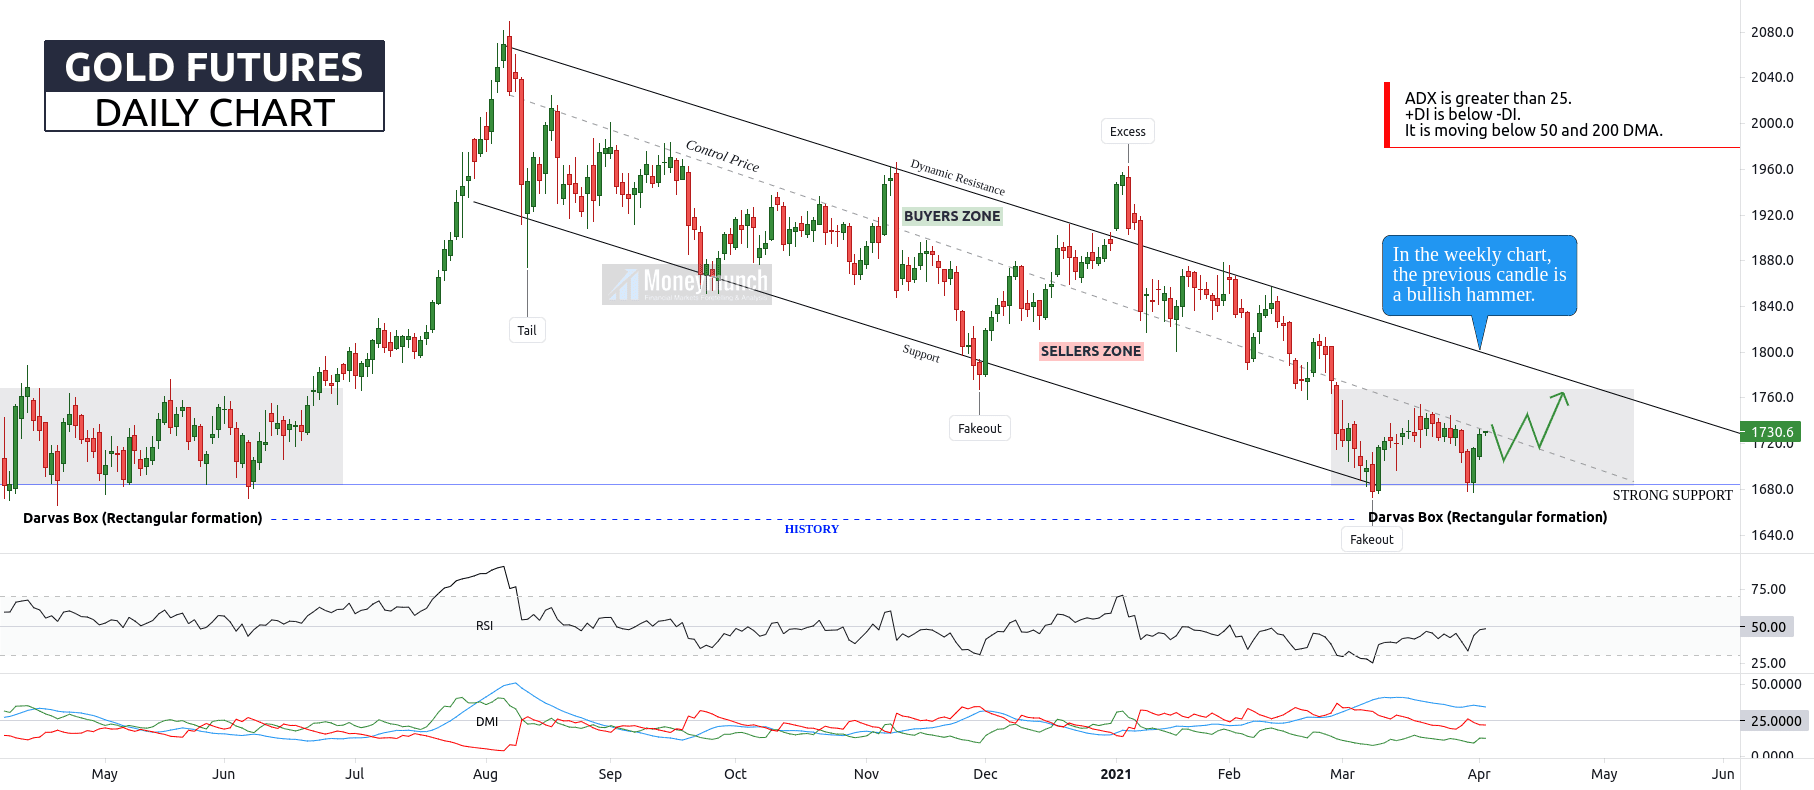
COMEX Gold Price Trapped at Control Price
Gold futures preparing to come at $1740 – $1750 – $1760. Day traders must wait for a breakout of the control price line before entering.
The uptrend will end whenever the gold spot price breaks strong support.
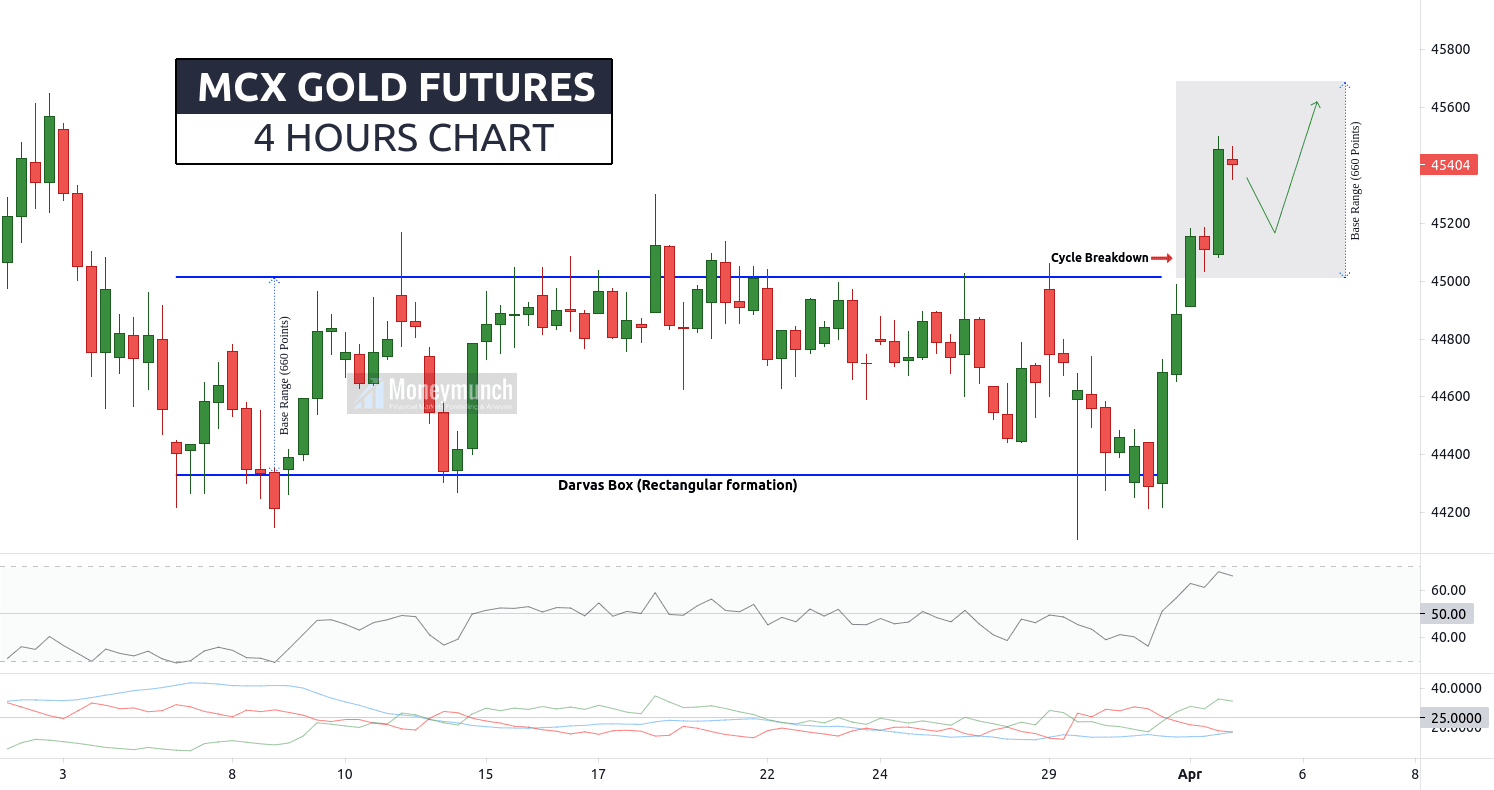
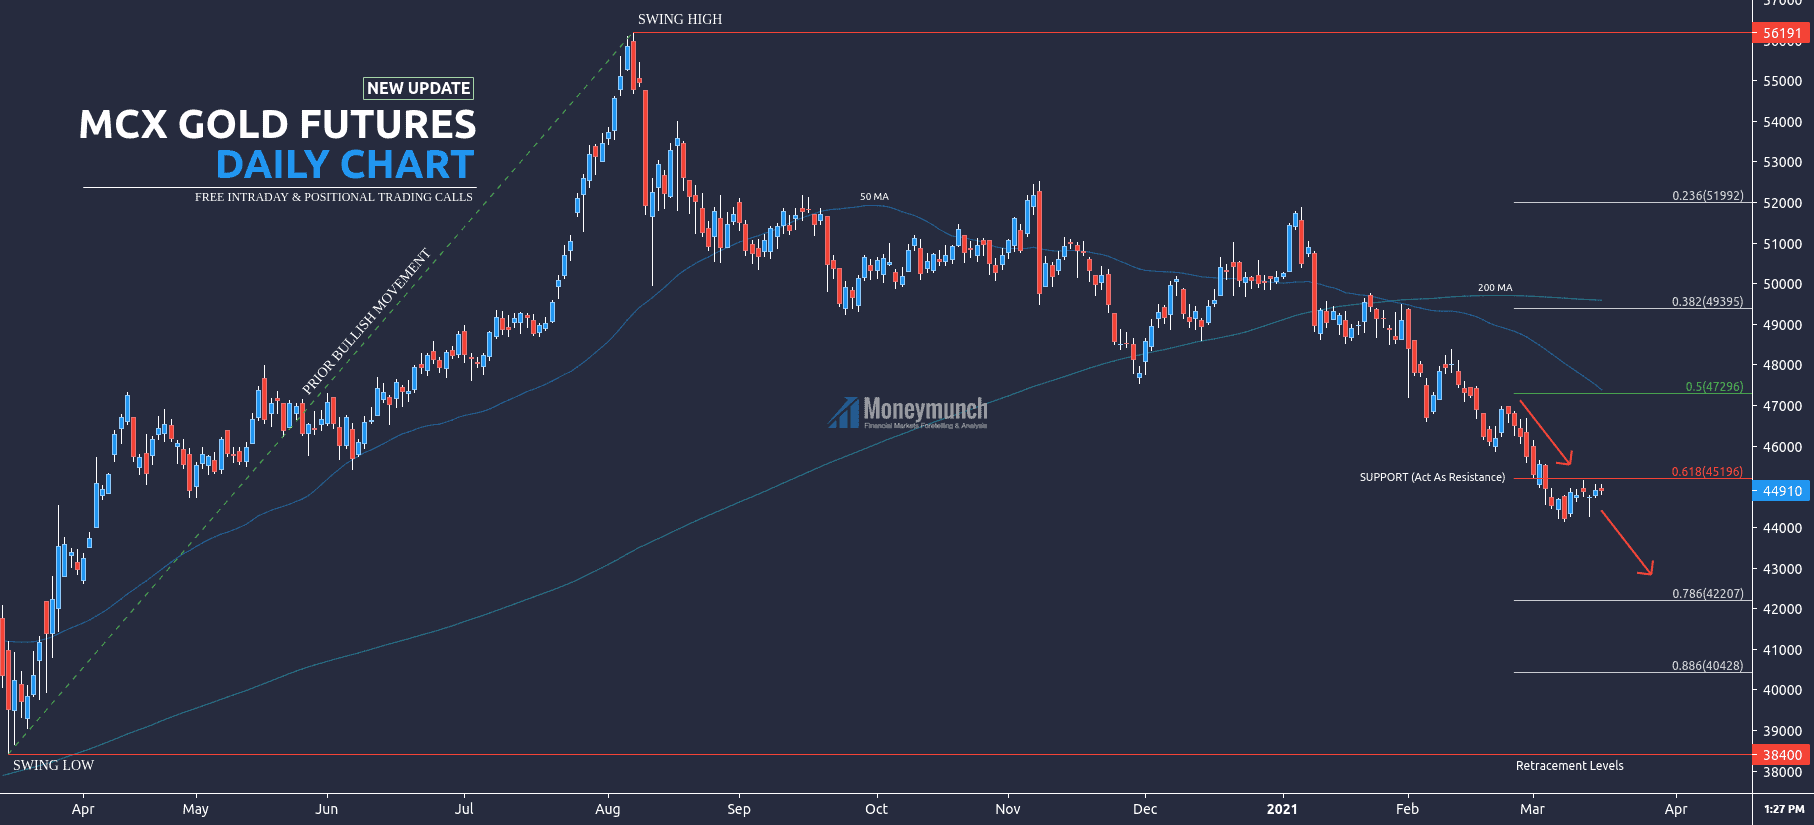
Is Gold Going To 45700 Or Higher?
The chart above indicating a clear uptrend continuation. We may see sideways movement before it hits the top of the rectangle.
According to the Darvas box (rectangular formation), MCX gold will move upward gently this week. Hence, intraday traders can jump between the range of 45200 – 45300.
Targets: 45560 – 45680
If gold breaks the bottom of the rectangle, don’t buy. And wait for my next update on the gold.
To become a subscriber, subscribe to our free newsletter services. Our service is free for all.
Continue reading

 Unlock This Article