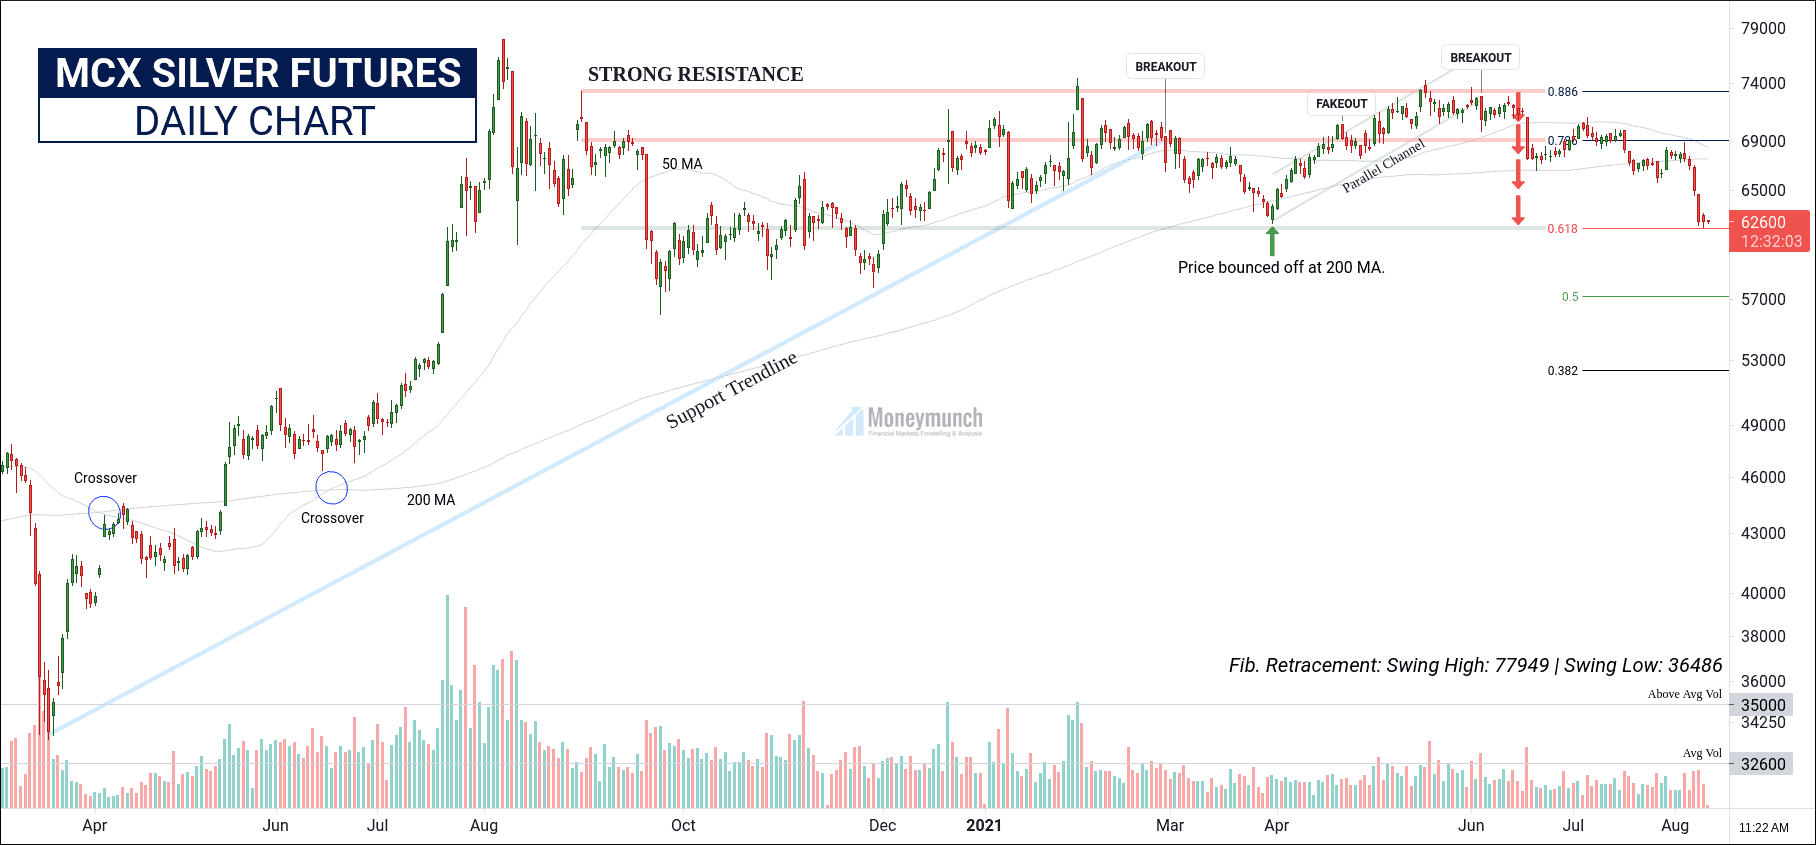
MCX Crude oil: Ascending Triangle Pattern (TP 5112)

Free commodity crudeoil tips & chart

Crude oil is forming an Ascending Triangle Pattern. According to the monthly chart and chart pattern analysis, the crude oil rally will not stop here. It will keep moving forward for levels of 5160 – 5300 – 5600+.

MCX crude oil target for intraday traders is 5112 level. To become a subscriber, subscribe to our free newsletter services. Our service is free for all.

Continue reading

Gold: Descending Channel Pattern with Breakout at Upside

free commodity gold daily chart calls

MCX gold will keep moving further advance up to the targets of 50000 – 51000 levels. But after the first target, gold will try to take a reversal for 0.382 to 0.236 levels of retracement.

Long-term Targets: 51575 – 52492+

To become a subscriber, subscribe to our free newsletter services. Our service is free for all.

Continue reading

MCX Mentha oil – Ascending Triangle Pattern Formation

free commodity menthaoil tips chart

Mentha oil can try to collapse up to the support line before hitting the following targets: 986 – 1000 – 1020

Attention: don’t buy below the support trendline.

This MCX Mentha oil research is based on the Feb 24 article.
Click the below link to read it: MCX Mentha Oil Overall Outlook Is ‘Strongly Bullish’

To become a subscriber, subscribe to our free newsletter services. Our service is free for all.

Continue reading

Trade-Setups on Maruti Short Target 6639 and 6483

How to find the next wave after the development of extended waves?
Two terms are important to understand for this Sample.
  • Extended Wave – The biggest wave of three impulsive waves (W1, W3, or W5) for the motive phase. In this, we expect gaps, surged, sharp moves in it.
  • Difference between points – A wave has two points, the starting and ending point. The distance between them is the difference between those points. For example, Wave 1 traveled from Rs. 30 points to Rs. 45 point. As a result, the difference between 45- 30 points is “15”.
The formula that we will use to find the 5th wave:

Difference of, 5th Wave = 3rd wave Extended – 1st WaveContinue reading

EWT Says: MCX Aluminium Will Come at 162 Level

free commodity aluminium tips chart

According to EWT, the 5th wave has been almost completed. The ABC correction will start soon. As mentioned in the chart, MCX aluminium will start collapsing for the target price of 176 – 172 – 168 – 162 soon.

At present, if we see for intraday traders, then it’s upward. Aluminium will touch 184 – 186 levels, and then ABC correction will start.

To become a subscriber, subscribe to our free newsletter services. Our service is free for all.

Continue reading