


Timeframe: Daily
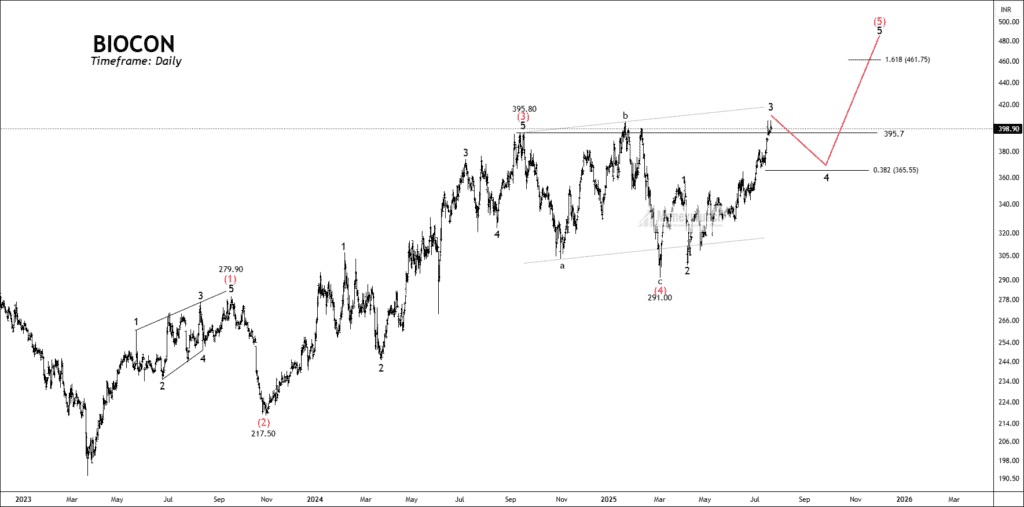
Biocon is currently exhibiting a classic Elliott Wave pattern on the daily chart, indicating strong bullish momentum. The stock initiated its uptrend with Wave (1) ending at 279.90, followed by a correction to 217.50 for Wave (2). This was succeeded by a sharp rally forming Wave (3), which peaked at 395.80. After that, the price entered a complex corrective phase, forming an a-b-c structure and concluding Wave (4) around 291.00. From there, Biocon resumed its upward move, beginning the final impulsive Wave (5), within which sub-waves 1, 2, and 3 are already visible, with Wave 3 topping out near 404.70.
At this stage, the stock is likely in the process of forming Wave 4 of (5), with a possible retracement towards the 0.382 Fibonacci level around 365.55. This minor pullback could set the stage for the final upward move in Wave 5, potentially reaching the 1.618 Fibonacci extension at 461.75. As long as Biocon maintains support above 365 and doesn’t break key trend levels, the overall structure supports a bullish outlook.
 Unlock This Article
Get free important share market ideas on stocks & nifty tips chart setups, analysis for the upcoming session, and more by joining the below link: Stock Tips
Have you any questions/feedback about this article? Please leave your queries in the comment box for answers.

Great work! Very simple to follow
Amazing call!