
Free Stock market / Nifty intraday tips, FREE Stock, Commodity & Forex tips

Ajanta Pharma: Bullish Breakout Signals Wave 3 Toward 3300+

Free nse ajantapharma chart calls

Free nse ajantapharma chart calls

Timeframe: Daily

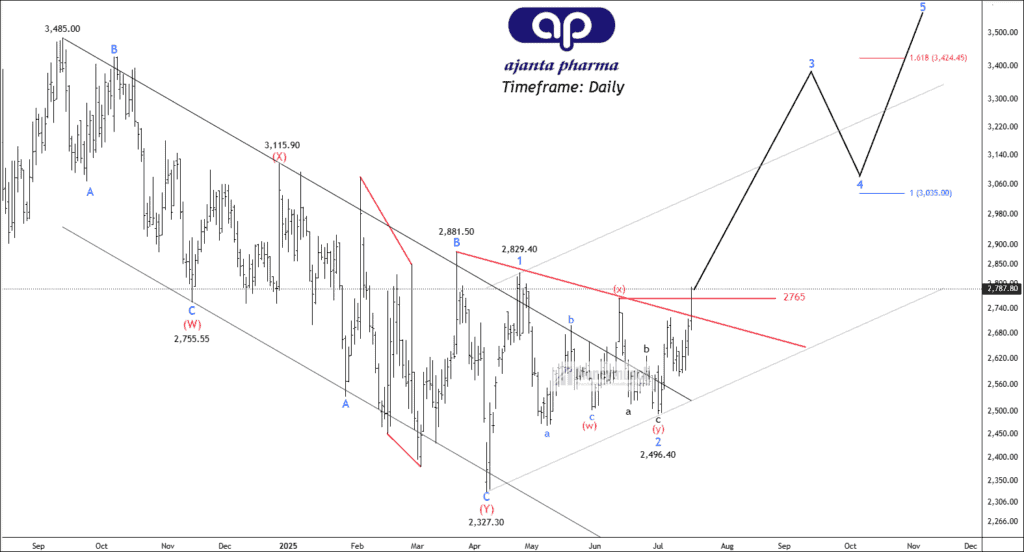
Ajanta Pharma seems to have completed a prolonged corrective phase, forming a W-X-Y pattern that ended near 2327.30. This correction began at the peak of 3485.00 and unfolded in a complex zigzag formation, ultimately setting the stage for a trend reversal. Following this, the price action indicates the start of a new impulsive wave count, with Wave 1 peaking at 2829.40 and Wave 2 bottoming out at 2496.40. The recent breakout above the crucial resistance of 2765 suggests that Wave 3 has likely started, and momentum is building on the upside.

Looking forward, Wave 3 is projected to extend toward 3300, and if the pattern holds, the entire 5-wave structure could complete near 3424.45, a key Fibonacci extension level. A brief correction around 3035 could mark Wave 4 before a final push higher in Wave 5. The structure remains bullish as long as the price stays above 2496.40, which is now a critical support and invalidation level. Targets for the setup can be 2890 – 2971 – 3099. The overall chart signals strength and a possible medium-term rally if the impulsive wave count continues to unfold as projected.

Get free important share market ideas on stocks & nifty tips chart setups, analysis for the upcoming session, and more by joining the below link: Stock Tips

Have you any questions/feedback about this article? Please leave your queries in the comment box for answers.

Disclaimer: The information provided on this website, including but not limited to stock, commodity, and forex trading tips, technical analysis, and research reports, is solely for educational and informational purposes. It should not be considered as financial advice or a recommendation to engage in any trading activity. Trading in stocks, commodities, and forex involves substantial risks, and you should carefully consider your financial situation and consult with a professional advisor before making any trading decisions. Moneymunch.com and its authors do not guarantee the accuracy, completeness, or reliability of the information provided, and shall not be held responsible for any losses or damages incurred as a result of using or relying on such information. Trading in the financial markets is subject to market risks, and past performance is not indicative of future results. By accessing and using this website, you acknowledge and agree to the terms of this disclaimer.
Previous ArticleNext Article
Mr.Guru(s) is a team of stock market certified technical and research analysts with over 20 years of experience. They are regular guests on popular online channels and contribute articles to several financial publications. Their insights and advice are respected by investors worldwide. With their collective knowledge and expertise, they have a proven track record of successfully predicting market movements and identifying profitable opportunities.

Join Today (Free): Stock & Nifty Tips

5 Comments

  1. I must say, this analysis is incredibly detailed and well-thought-out! The way you have connected the wave structure with potential targets shows a deep understanding of the market.

Write a Comment

Comment Policy: We love comments and appreciate the time that readers spend to share ideas and give feedback. However, all comments are manually moderated and those deemed to be spam or solely promotional will be deleted. Your email address will not be published. Required fields are marked *