

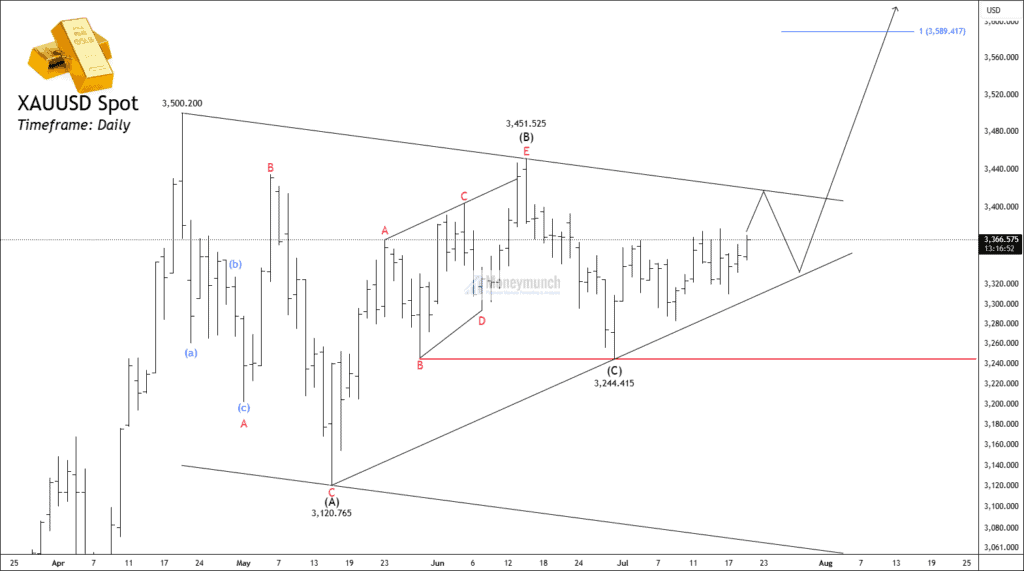

Timeframe: Daily
The Elliott Wave count on the daily chart of XAUUSD shows that a correction might have ended. The fall from 3500.2 to 3120.7 is labeled as Wave (A), which looks like a simple three-wave move, suggesting it’s part of a correction. After that, Wave (B) formed a clear triangle pattern with five legs (A to E), ending near 3451.5. This kind of triangle often appears in corrections. Then came Wave (C), which dropped to 3244.4 and seems to have completed the full A-B-C correction phase. The alternative count is the wave 4 triangle.
If the price breaks above the upper trendline of the triangle, it could be a sign of a new upward move. In that case, traders may look for targets around 3475 – 3520 – 3555+. However, it’s essential to note that this triangle setup remains valid only if the low of Wave C at 3244.4 is not breached. If the price goes below that level, the triangle would be invalid, and the market might take a different path.
We will update further information for premium members soon.
Get free forex & currency ideas, chart setups, and analysis for the upcoming session: Forex Signals →
Want to get premium trading alerts on GBPUSD, EURUSD, USDINR, XAUUSD, etc., and unlimited access to Moneymunch? Join today and start potentially multiplying your net worth: Premium Forex Signals
Premium features: daily updates, full access to the Moneymunch #1 Rank List, Research Reports, Premium screens, and much more. You΄ll quickly identify which commodities to buy, which to sell, and target today΄s hottest industries.
Have you any questions/feedback about this article? Please leave your queries in the comment box for answers.

Gold will fire soon.
They will take the gold prices all the way up and then crash the whole market…
Gold has no future ahead. Bitcoin is as real as diamonds and gold..