Will Gold Hit The 60000 Level?
Timeframe: Daily
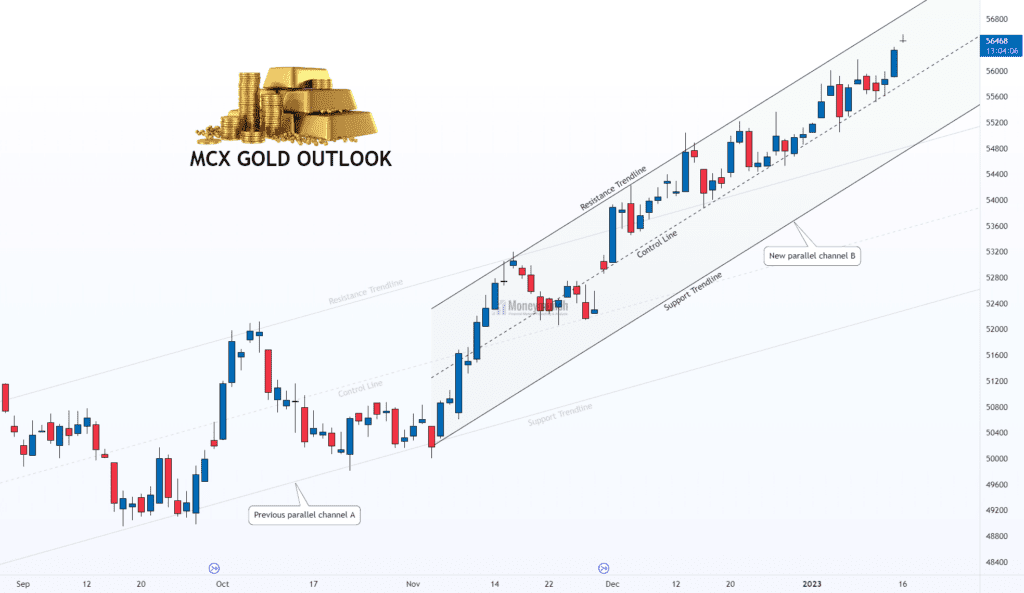
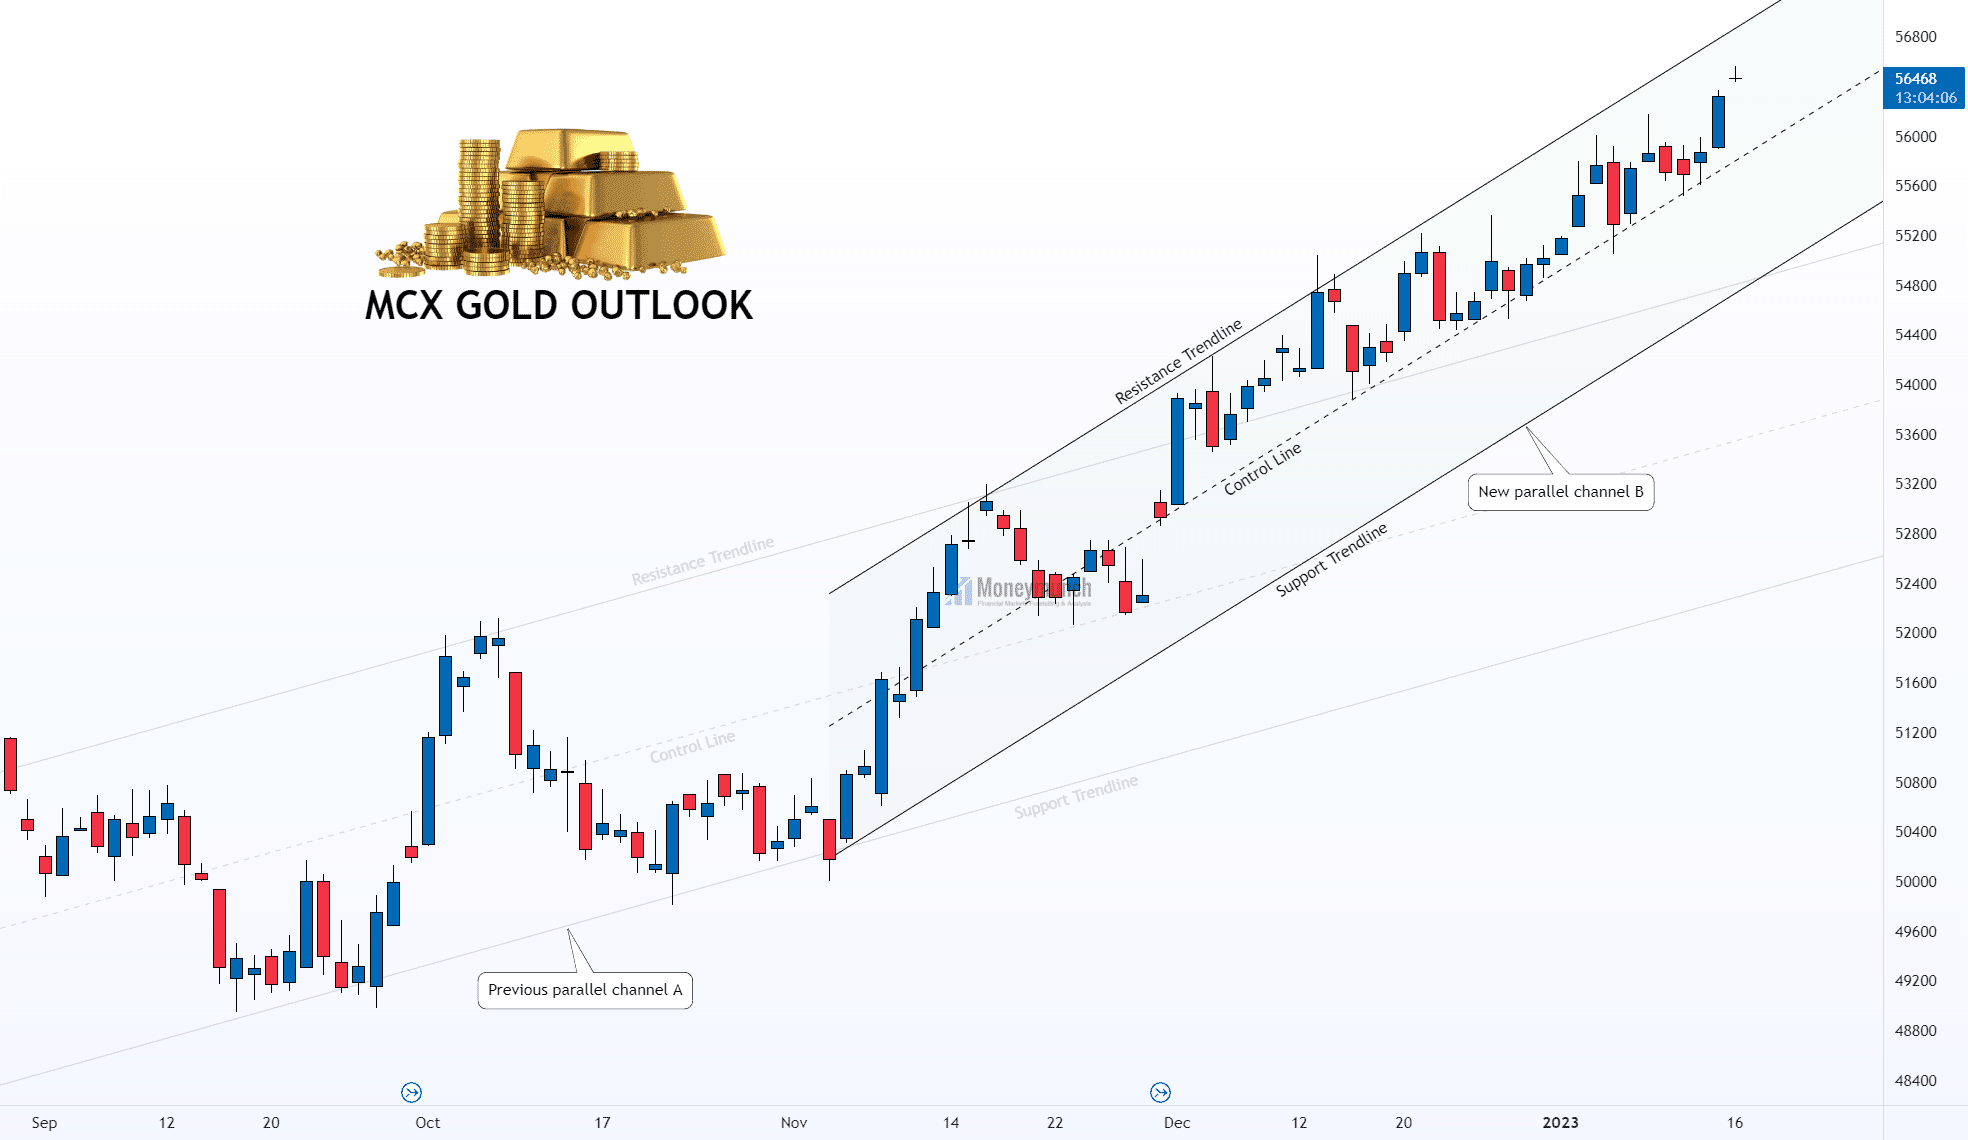
See the above chart gold is flying. In the previous trading session, MCX gold broke 56191 all-time highs of 07 August 2020. It made a new parallel channel B. It seems to be moving toward the 60000 level. But according to the previous data, this process may take more time.
I don’t see any reversal sign still yet. Hence, we can expect 56800 – 57000 – 57200+ levels. This week’s reversal can be up to 56260 – 56000.
The biggest question for day traders is where will gold stop?
Simple answer: Keep eyes on the control line and the support trendline breakout before entry. It will help you to make the right decision. More information will be updated for members shortly.(To become a subscriber, subscribe to our free newsletter services. Our service is free for all.)
Watch significant releases or events that may affect the movement of gold, silver, crude oil, and natural gas.
Tuesday, Jan 17, 2023
12:30 Employment Change 3M/3M (MoM) & AEI (Nov) – Medium Impact
Wednesday, Jan 18, 2023
01:30 FOMC Member Williams Speaks – Medium Impact
19:00 Core (Retail) Sales and PPL (MoM) (DEC) – High Impact
20:30 Retail & Business Inventories – Medium Impact
Thursday, Jan 19, 2023
00:30 FOMC Member Harker Speaks – Medium Impact
02:30 TIC Net Long-term Transactions – Low Impact
04:30 Fed Logan Speaks – Low Impact
Get free MCX ideas, chart setups, and analysis for the upcoming session: Commodity Tips →
Have you any questions/feedback about this article? Please leave your queries in the comment box for answers.


Thank you for your excellent work. I think gold has the potential to go above 60,000.
Good Insight Dev sir.
I agree with your analysis👌