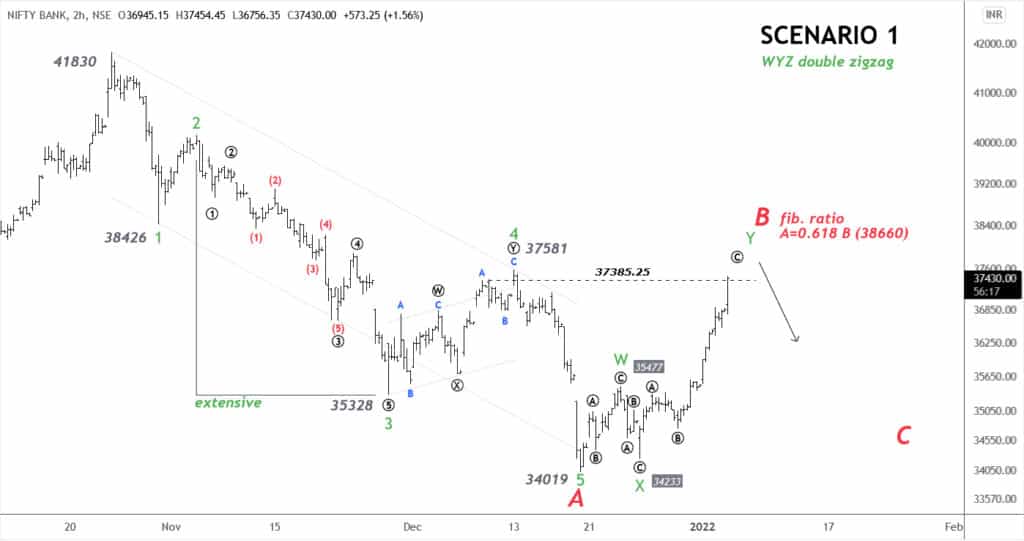
A =0.618 B (38660), I wouldn’t want to see the prices cross and close above 61.8% ratio that is wave 1 at 38426 nearby of A and comes into play as resistance the previous swing high 37581(Wave 4) nearby.

OR

A five-wave decline in the BANK NIFTY , from 41830(Oct.) to 34019(Dec.) is complete. The 34019 low is wave A of a larger five-wave decline. The 2h range chart shows that wave B took the form of a double zigzag pattern, carrying to meet the top (W=0.618 Y) 38660. The previous 37385 resistance zone can again react as resistance. Currently, everything are positive on the day before and the day after, but wave ((Y)) (circle) of C of B can be labeled.
As those familiar with the Wave Counting model know, the B (corrective) wave in a downtrend is a counter-trend price move. In other words, it’s up. When wave B is complete, wave C down follows.
To become a subscriber, subscribe to our free newsletter services. Our service is free for all.
Get free important share market ideas on stocks & nifty tips chart setups, analysis for the upcoming session, and more by joining the below link: Stock Tips
Have you any questions/feedback about this article? Please leave your queries in the comment box for answers.