NSE HEROMOTOCO – Premium Setup
 Unlock This Article
Only subscribers can read the full article. Please login to read the entire article.
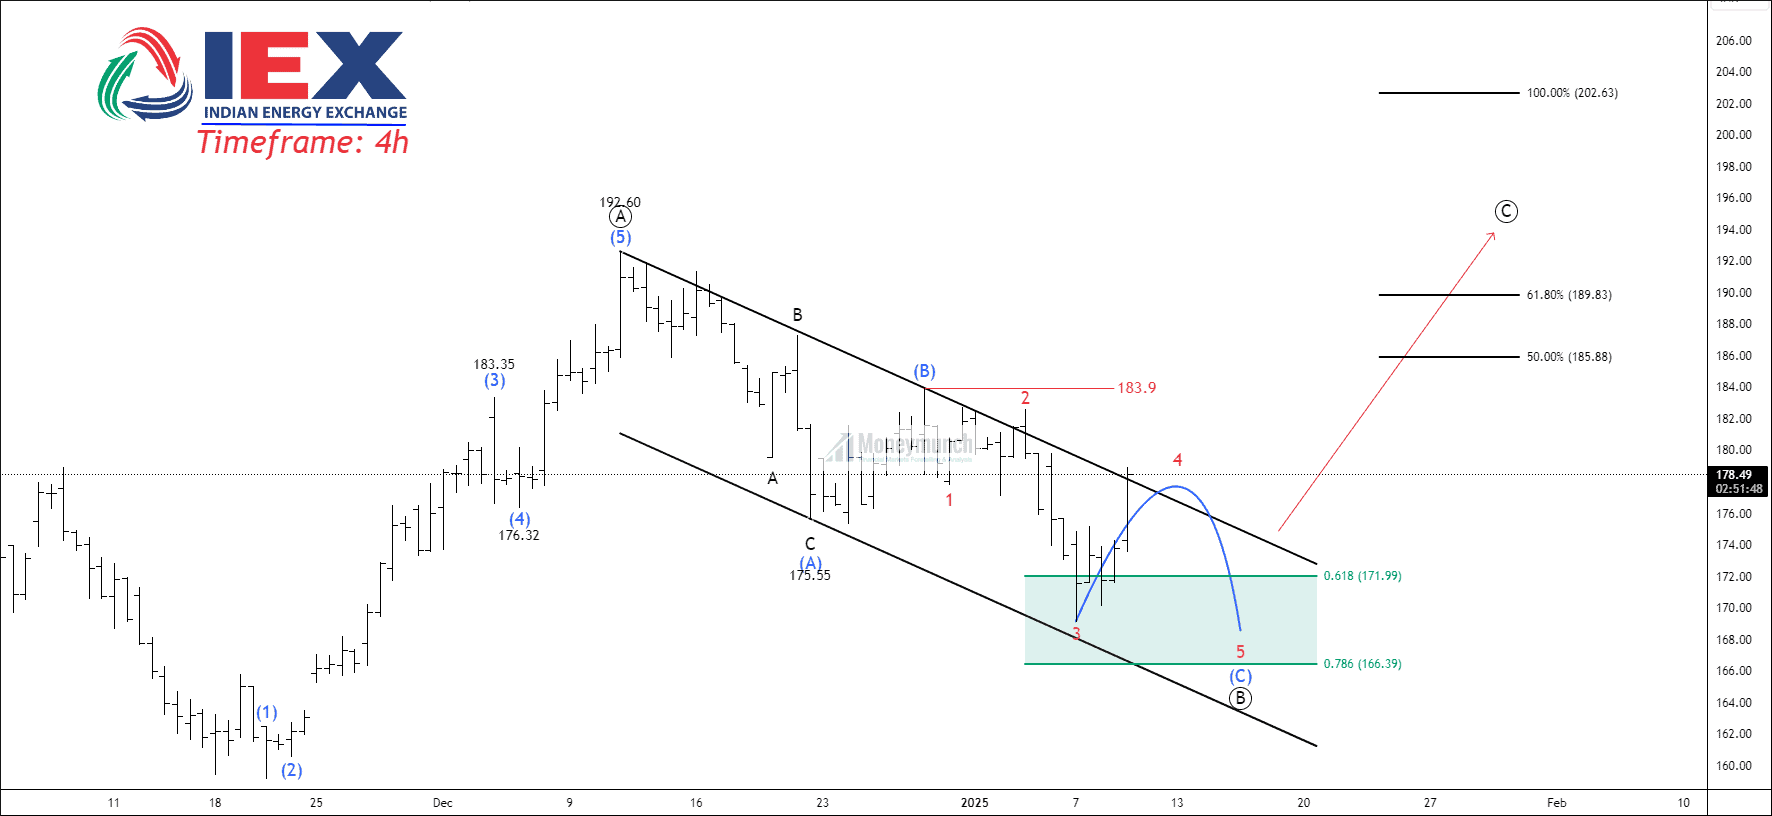
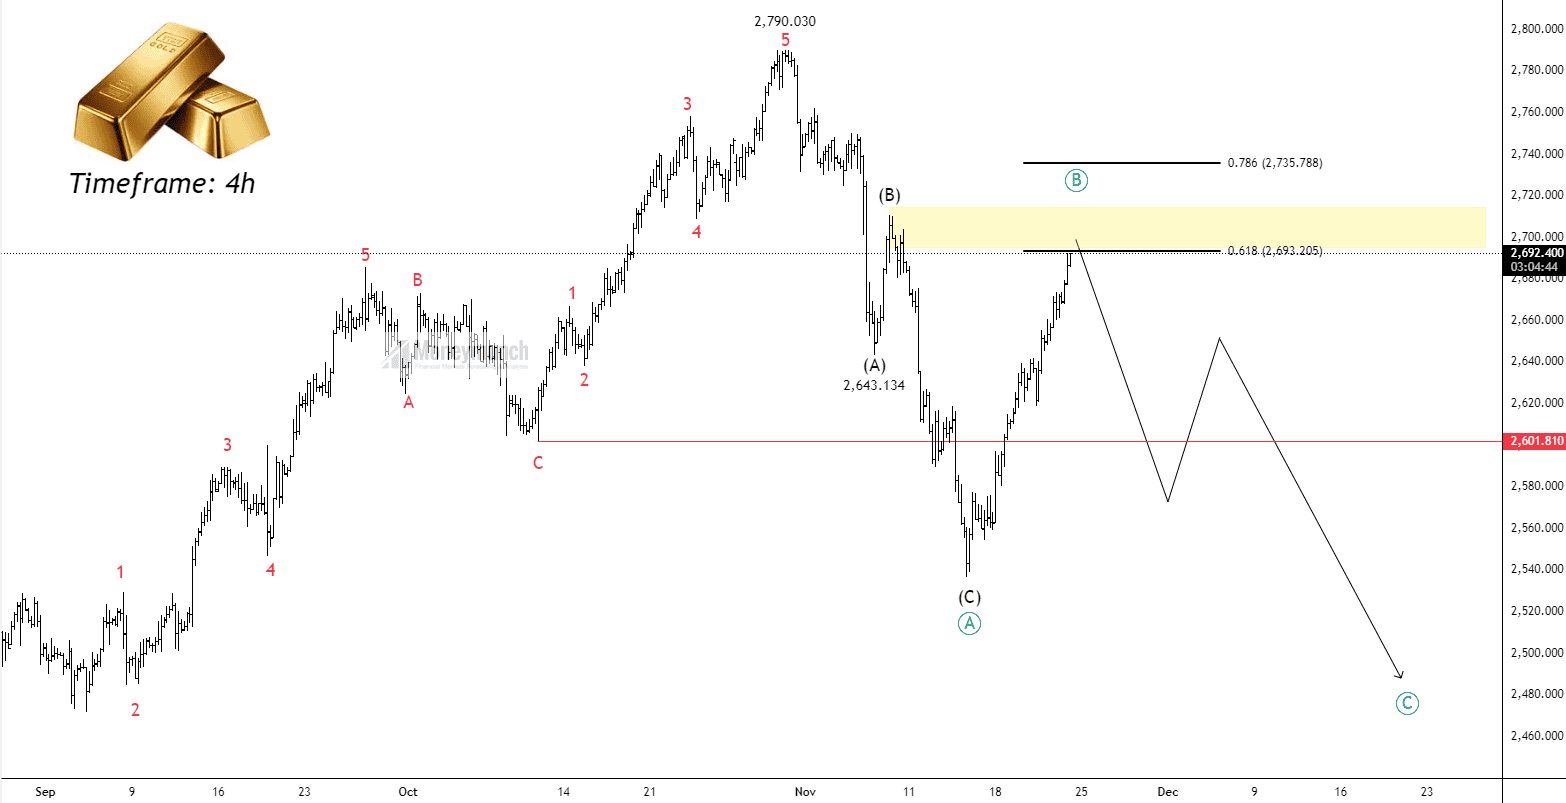
XAUUSD: Corrective Phase Setting the Stage for a Bull Run
Swing Traders, IGL Counter-Setup On Next Stop: At Corrective Wave Pattern
I spend much of my spare time analyzing markets as many of you know. Yes, analysis is my day job, but it is also my passion. So, whenever the weekend comes around, I spend most of my time studying price charts in front of the computer. Though was looking for the swing trade setup for F&O NSE, At a lower timeframe I found Ending-Diagonal on IGL which is a highly reliable one of 13 patterns for R.N Elliott. So I decided to explain it.
The trend identifying Monthly Line-Chart on Log-Scale

Because of line chart simplicity, we’re just looking to identify the trend purpose which is a clear visualization of the primary trend. A popular trading expression is “the trend is your friend.” Therefore, your long(buying) side trade will be referred to as the main or primary trade setup.
The Monthly bar-chart Log-Scale for more clarity on what is going on inside up-trend and its up-down personality.

The bar-chart Log-Scale for more clarity on what is going on inside up-trend.
The support is still too far at or near the lower boundary line at the parallel price channel but Sometimes, the middle line would work as support also. This is essentially what I work with support at the bottom line or middle line. A price is near the middle line or a little below it that is why I would like to create a long trade-set-up.
Don’t ignore this outcome from the bar-chart: A trend is a downside in the range of parallel channels.
Before getting started to apply the wave principle, let’s look up previous significant support & resistance at the Monthly Arithmetic Scale.

In a technical analysis term “Flip Range” refers to the small price range that dramatically changes its direction and touches it repeatedly.
A Significant “Flip Range”: 345 to 364 where I am going to create a long setup for a pullback.
The wave principle is applied on IGL at the monthly log-scale time frame.

As you can see in the price chart, I labeled using Elliott wave principles and recognized that a price is trading in the corrective mode. More importantly, the wave ((ii)) is exactly 61.8% multiple & wave ((iii)) is just beyond the 3.618 extended ratios but wave ((iv)) is deeper at 78.6% which is not a common or expected ratio on a log scale. A wave ((v)) is an extended wave.
Let’s jump on the 2-Days time frame for clear visualization of the Ending Diagonal.

- Therese important support for pull-back – 366-64/351 & 284.
- A sharp correction has occurred after the Ending Diagonal is terminated.
- The Ending Diagonal is a terminating wave pattern.
In real-time trading, I’ll create trade-setups utilizing the above supports. For instance, I’ll look for a pullback entry in the price range from 344 to 364 long side but during the trading hours, I always focus on price action to take action.
To take action 4-hours chart at regulate scale:
Only subscribers can read the full article. Please login to read the entire article.
To become a subscriber, subscribe to our free newsletter services. Our service is free for all.

Continue reading
Awaiting Triangle Thrust in SRF
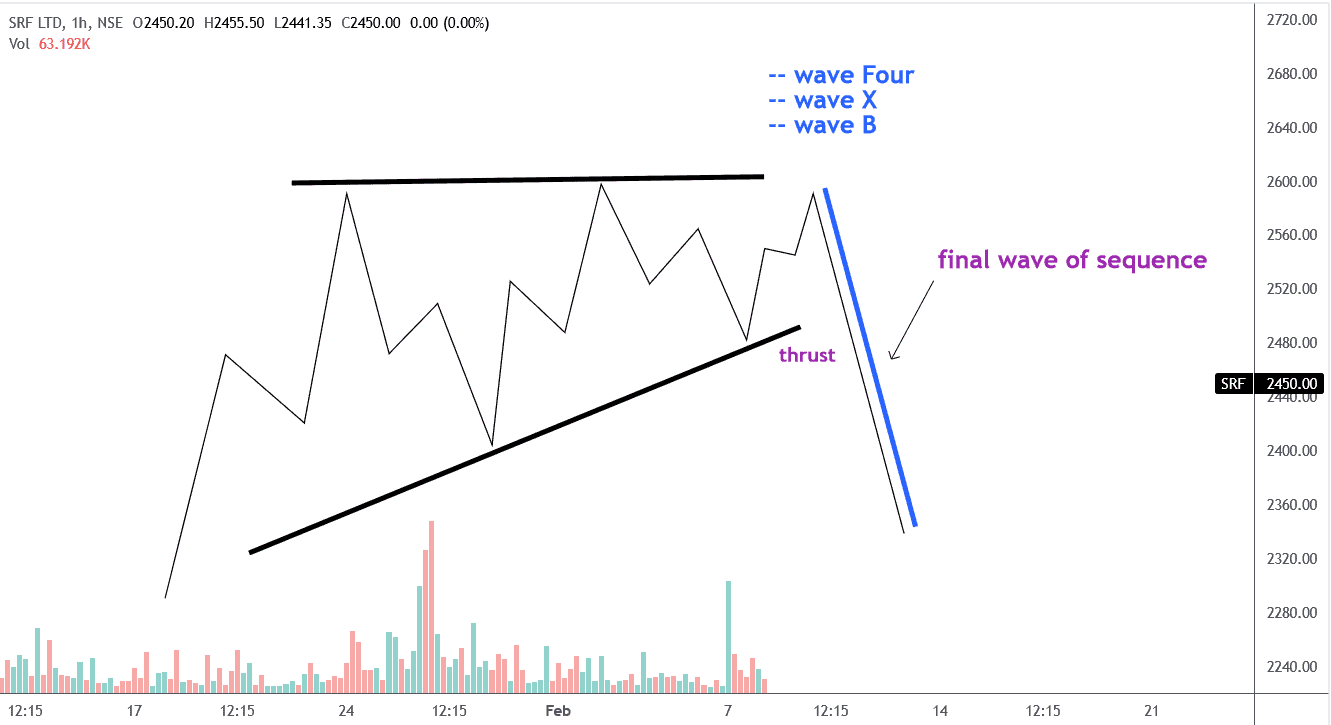 Getting started with today’s real-time research, I’m going to talk a little about triangle types and their position. If you are calling from my recent posts, I have written various types of Triangles: 1. Contracting triangle, Expanding triangle, and Barrier triangle. I’m going to be showing you a triangle thrust measurement technique and going to be utilized to identify a high probability target. The Triangles are limited in where they can from by themself at wave 4, Wave X and Wave B and rarely wave 2.

Protective Stop, Critical Resistance and Failed Pattern:-
Only word of caution with respect to this pattern in this market at this time that prices have yet to get below extreme of wave “D”. On an hourly closing basis being the case, that means we can actually see maybe another move to the upward OR a more time-consuming wave “E” OR wave “E” itself can actually form into a triangle. Therefore, until the price actually get below the extreme of wave “D” on an hourly closing basis. You need to do is simply view this point right here in the extreme of wave “C” as are critical support level for this interpretation. Whenever the price close above critical support, it means simple I’m wrong. But, the price would come below extreme of wave “D” on a hourly basis that would provide very strongest evidence for this pattern is indeed to complete. And, then the price is going to see a thrust.
Thrust Measurement Technique:
At the origin of the move for ABCDE triangle or simply taking the widest portion of the triangle in measuring it. In this real-time instance, expecting trust measurement move is approximately at 2226 downside from the extreme of wave E.
Trade-Setup:
I’ll divide the “Trade-Setup” into two portion, one for Aggressive Trader and other for Safe-Trader. The safe trader can take action after breaking down wave “D” on basis that means after revealing the evidence of thrust move. An aggressive trader can act at or nearby “Critical Support” in advance. Yes, absolutely traders can create their position at these both trade-setup.
Therefore,
Trade 1: Sell SRF in base of cash/equity market price 2495-2425 for Aggressive Traders
Trade 2: For the Safe Traders, Sell 2410 below and protective stop is above wave “E” after confirmed and, target ratio 1:3 minimum.
To become a subscriber, subscribe to our free newsletter services. Our service is free for all.
Continue reading
Wave Counting & Head & Shoulders Pattern on multi-time frame for AXISBANK
First, we’re going to do a review of the wave principle if you are new or beginners. The wave principle is a form of technical analysis that is based on crowd psychology and pattern recognition. What the wave principle does is provide the context of you and it does so by means of two different modes.
- Motive waves and,
- Corrective waves
Within the Motive wave family we have two types: impulse wave and diagonal. For the Corrective wave family we have 3 types: Zigzag, Flat and Triangle.
Let’s first examine what an impulse wave looks like.

This is what a classic or standard “Elliott Wave” impulse wave real-time example in above chart. It is a 5 wave non-overlapping move waves 1,2,3,4 and 5. Therefore, those who have some experience with the wave principle will recognize the “wave 3” as an extended wave. Here, within this move to the upside, this impulse wave. The reason it’s so important is that it defines the trend of the next launcher degree, therefore this could be either “wave (1)” or “wave (B)”.
Now there’s some rules that pertain to the structure.

Continue reading