

Divi’s Laboratories Prepares for Wave 3: Target ₹6,990

Timeframe: 4h
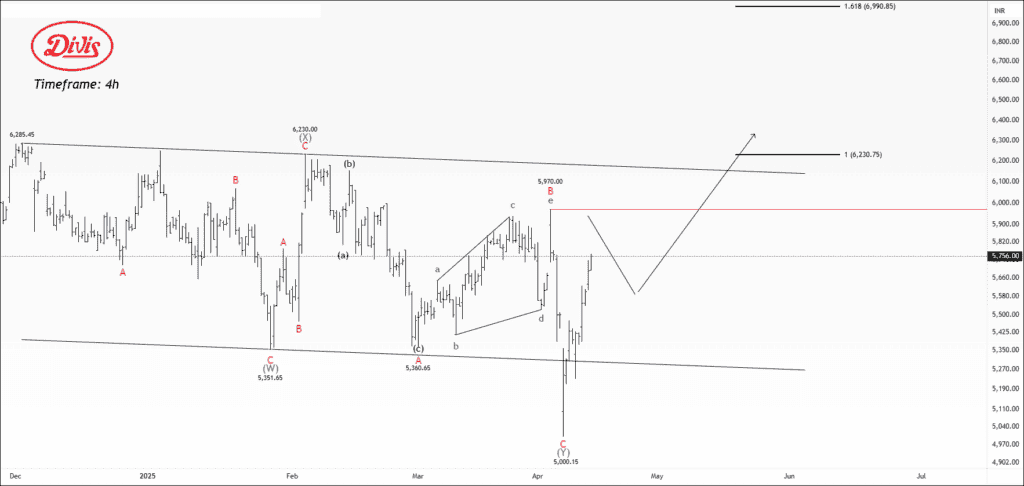
The 4-hour chart of Divi’s Laboratories Ltd (NSE) reflects a completed WXY corrective structure, with Wave (Y) bottoming out near 5,000.15 after an extended correction from the 6,230.00 region. The price has since shown a strong rebound, indicating the potential beginning of a fresh impulsive wave to the upside. This movement, supported by a breakout from a descending channel, suggests that bullish momentum may be building. A key level to watch is 5,970, which marks the top of the recent triangle pattern and the neckline of the potential breakout structure.
If the price sustains above 5,970 and breaks past the previous swing high of 6,230, it could confirm the start of a new bullish leg, with targets at 6,300 – 6,540 – 6,990+ based on the Fibonacci extension. However, failure to break and hold above 5,970 may lead to a retest of the 5,580–5,690 support zone. Overall, the chart favors a bullish outlook as long as the price holds above 5,690, with higher probabilities for an impulsive rally unfolding in the coming sessions.
We will update further information soon.
NSE NIFTY – Price Action Outlook
Timeframe: Daily
This zone(23800) has previously served as a strong resistance, marked by several reversal candles and failed breakout attempts. The price has rejected from this area multiple times, establishing it as a key level where sellers tend to take control. The price dropped sharply to 21,743, only to experience a significant bullish rebound, indicating that this is a demand zone.
There’s also a noticeable bullish gap of over 1.25%, which is clearly visible in the latest price move. A similar-sized gap occurred around the supply zone in the past, suggesting that both buyers and sellers are active at these critical levels, contributing to high volatility.
Currently, the index is nearing a major resistance zone around 23,700–23,800. A breakout above this zone with strong volume could signal a continuation of the bullish trend, possibly pushing the price toward the 24,500+ levels. However, if the price fails to break through this resistance and forms a bearish candle near the zone, it could lead to a pullback, especially if the market reacts negatively around 22,800. Traders should closely monitor price action near 23,700 and 22,800 for potential short-term signals.
We will update further information for premium members soon.
Get free important share market ideas on stocks & nifty tips chart setups, analysis for the upcoming session, and more by joining the below link: Stock Tips
Have you any questions/feedback about this article? Please leave your queries in the comment box for answers.

Definitely on a great Wave chart brother