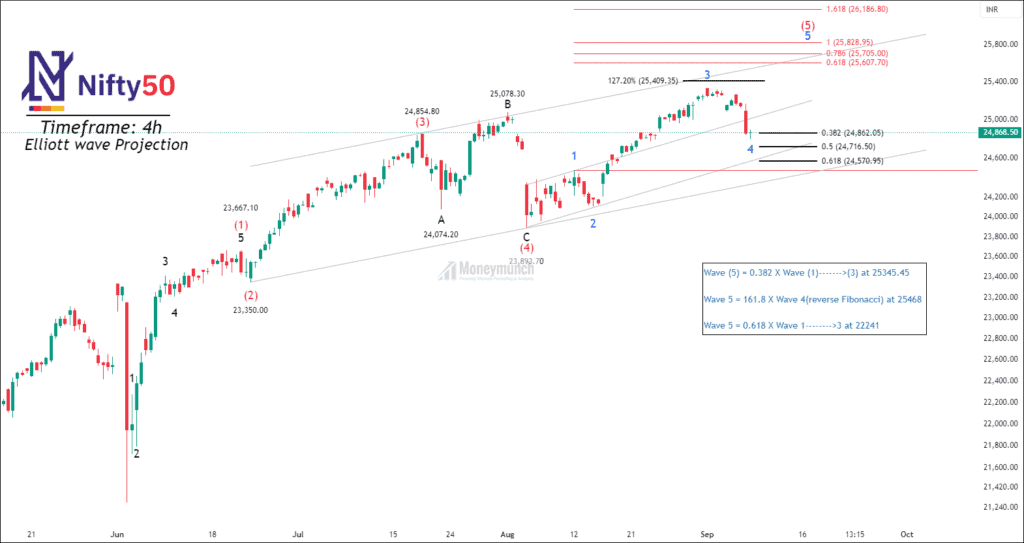
NSE NIFTY – Elliott Wave Outlook

Timeframe: 4h
 Unlock This Article
NSE SBICARD: Capturing the Momentum of Wave 3
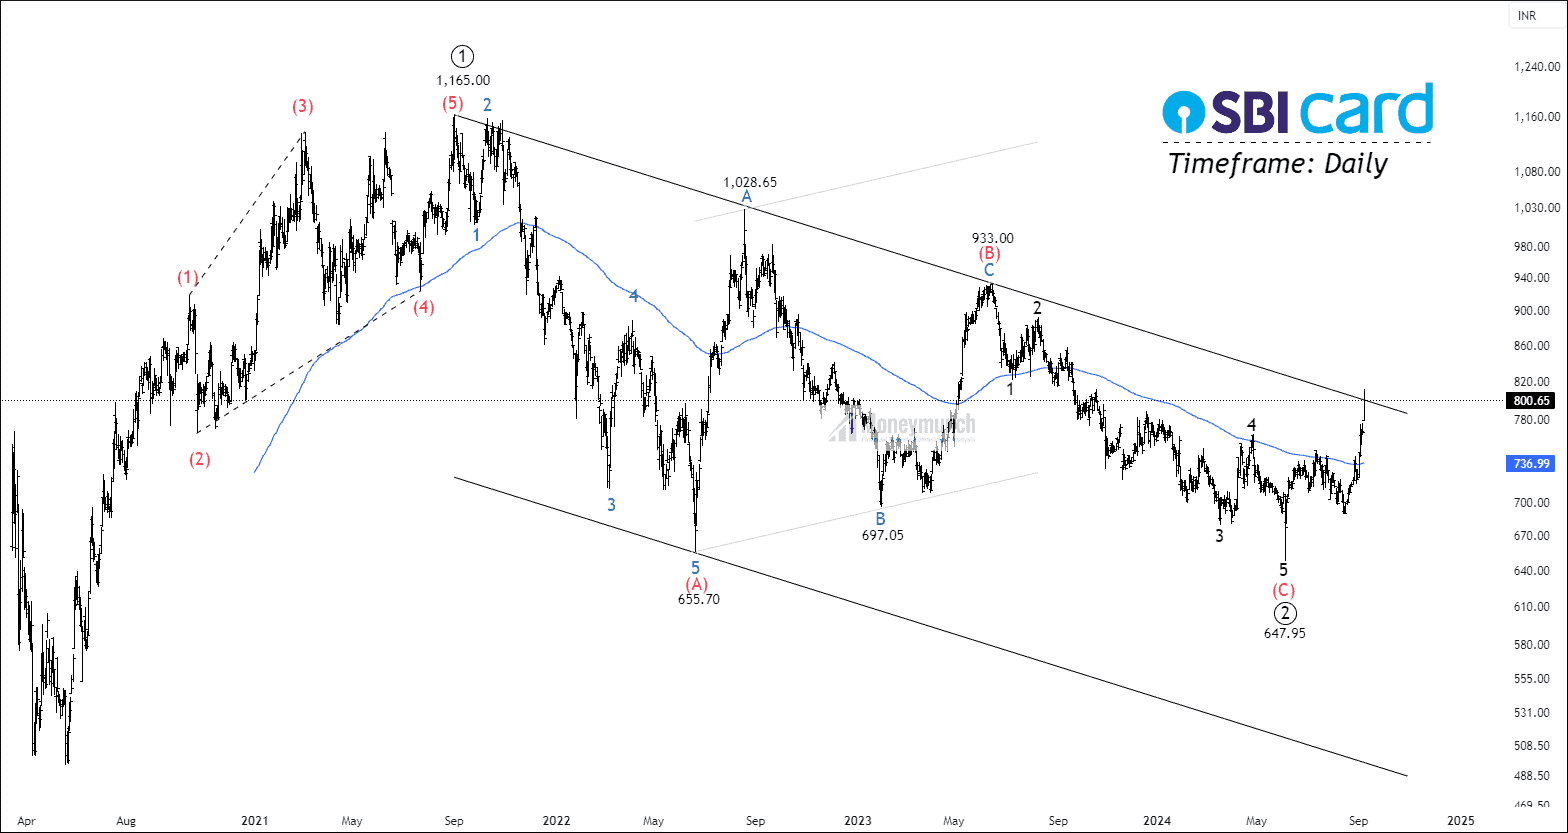
Timeframe: Daily
The NSE SBI Card stock has been in a correction phase for over 22 months, with prices moving sideways after reaching a high of 1165. Wave ((1)) formed as a diagonal, followed by an (A)-(B)-(C) corrective structure in wave ((2)). Currently, the price is trading above the 200 EMA, and the Average True Range (ATR) stands at 16.6.
The price completed the final wave (5) of wave (c) within wave ((2)) at 647.95, followed by a sharp surge. The base can be identified as waves 1-2, with the surge representing wave 3. The sub-waves of wave ((3)) are becoming apparent. Wave ((3)) is forming impulsively and is likely to reach at least 1165 (100% of wave 1), with a common extension target of 1490 (161.8% of wave 1). If the price breaks out and sustains above the parallel channel, traders can consider entering this potential opportunity.
Get free important share market ideas on stocks & nifty tips chart setups, analysis for the upcoming session, and more by joining the below link: Stock Tips
Have you any questions/feedback about this article? Please leave your queries in the comment box for answers.
Great insights!
Excellent overview, Keep sharing it!
Yes please
I think we’re almost there.