


In the previous article, we mentioned the breakout level of 782.25. The price couldn’t break that level and fallen for 9.3%.
The price has fallen for 8.2% within 30 weeks. The falling structure is marked as (W) – (X) – (Y), which is a time-consuming and choppy formation. The correction is likely ending as multiple clusters are seen between 716 and 695.
After the completion of wave C of wave (Y), traders can long for the following targets: 742 – 769 – 785+. Free subscribers can take the previous day’s low as an invalidation level.
NSE SAIL – Elliott Wave Projection
NSE SAIL bounced strongly from support and moved higher with good strength. It has now formed a clear value area between 145 and 153, showing healthy consolidation. Volume expansion after a quiet phase supports accumulation in this zone. The stock is holding near the upper end of the range. Trend remains positive as long as the price stays above 145.
If price sustains above 153, traders can long for the following targets: 157 – 161. – 166+. Free subscribers can take the previous day’s low as an invalidation level.
 Unlock This Article
KARURVYSYA: Bulls Take Control as Price Clears 279.5
Price has broken a strong resistance zone with a solid bullish candle. Volume spike confirms genuine buying interest, not a fake breakout. This Structure shows higher highs and higher lows, indicating a bullish atmosphere. As per wave projection, we are at sub-wave 5 of wave (5). 279.5 is a crucial hurdle
If the price sustains above 279.5, traders can go long with targets of 290 – 299 – 311. Free subscribers can use the previous day’s low as a point of invalidation.
NSE TECHM – Premium Setup
NSE EIDPARRY – Bull Trap Ahead
👉 Before reading this, visit EIDPARRY’s Wave Projection.
Click here: NSE EIDPARRY Is Sitting on the Ticking Bomb!

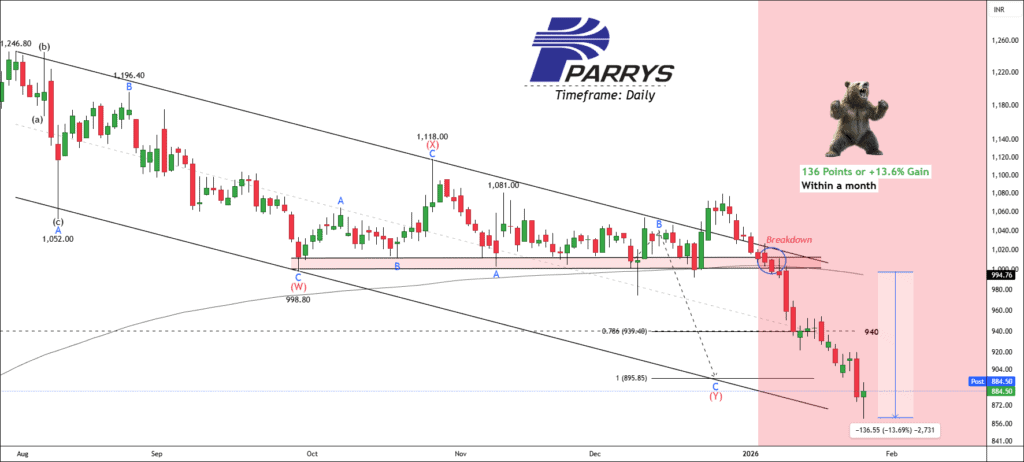
We had written clearly, “If the table turns bearish, Wave C fall can be 971 – 940 – 890.”

Timeline:
[8 January 2026]
- 11:45 AM: Price hit the first target of 971.
[9 January 2026]
- 02:00 PM: EIDPARRY hit the second target of 940.
[23 January 2026]
- 12:15 PM: EIDPARRY hit the final target of 890.
If you had traded this setup, you could have gained more than 141 points or +14% within five days. What do you expect more from a free setup?
What’s Next?
The price has touched the lower band of the channel, and bulls shown the buying interest from that level. The security price needs to sustain above 940 to confirm the impulsive formation.
Premium subscribers will receive a detailed outlook on Eidparry soon.
Get free MCX ideas, chart setups, and analysis for the upcoming session: Commodity Tips →
Have you any questions/feedback about this article? Please leave your queries in the comment box for answers.

Can i get stock and forex tips both in paid plan?
Perfect counts as always, DO PROVIDE NIFTY AND FINNIFTY UPDATE.
Thanks this signal. Because of this setup, i could cover my old losses. I want your premium service to bridge the gap. Thanks again!