

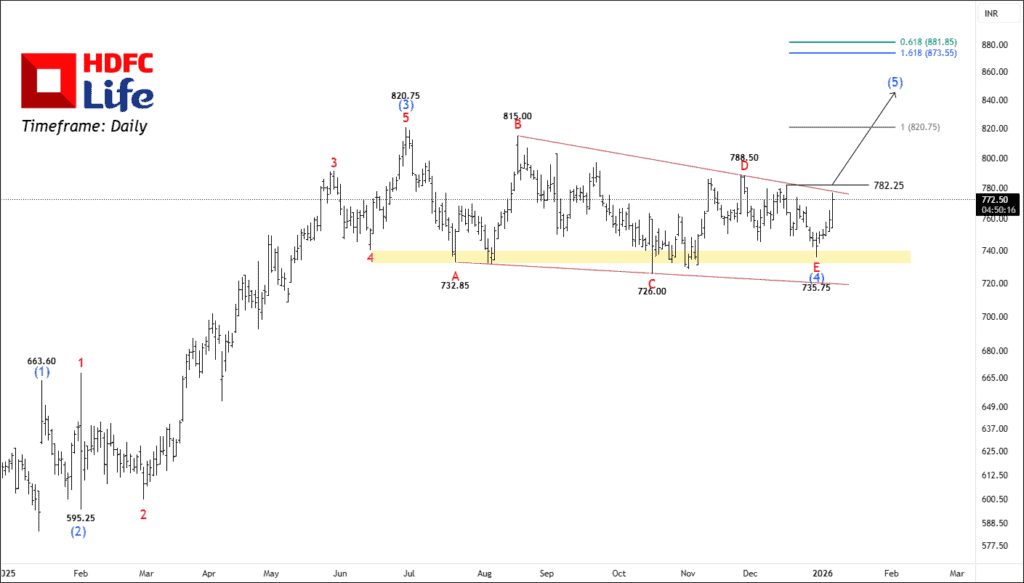

HDFC LIFE has constructed 4th wave triangle on the daily timeframe chart. Wave (3) occurred at 820.75, and wave 4 has taken place for more than 28 weeks. The price is trading above the 200 EMA.
If price sustains above 782.25, traders can long for the following targets: 805 – 820 – 848+. The setup is valid until the breakdown of wave E at 735.75.
We will update further information for premium members soon.

Price is still moving inside a falling channel, so the overall trend remains negative. The recent rise looks like a temporary bounce, not a new uptrend. Buying pressure is weak, as price has failed many times near resistance. The yellow zone near wave B is a strong selling area.
Real bullish strength will appear only if the price breaks above wave B and holds there. If the price is rejected from this zone, a fall toward 430 – 420 is still possible. Until a clear breakout happens, buying carries high risk. After completion of wave (z), traders can buy for the following targets: 547 – 578 – 610+. This setup is better for wait-and-watch traders, not aggressive buyers.
We will update further information soon.
Get free important share market ideas on stocks & nifty tips chart setups, analysis for the upcoming session, and more by joining the below link: Stock Tips
Have you any questions/feedback about this article? Please leave your queries in the comment box for answers.

Please assist me with your paid calls. I’m really impressed with your wave charts.
Thank you!
Niranjan Patil,
Nasik, Maharashtra