FOR THE DAY TRADERS:
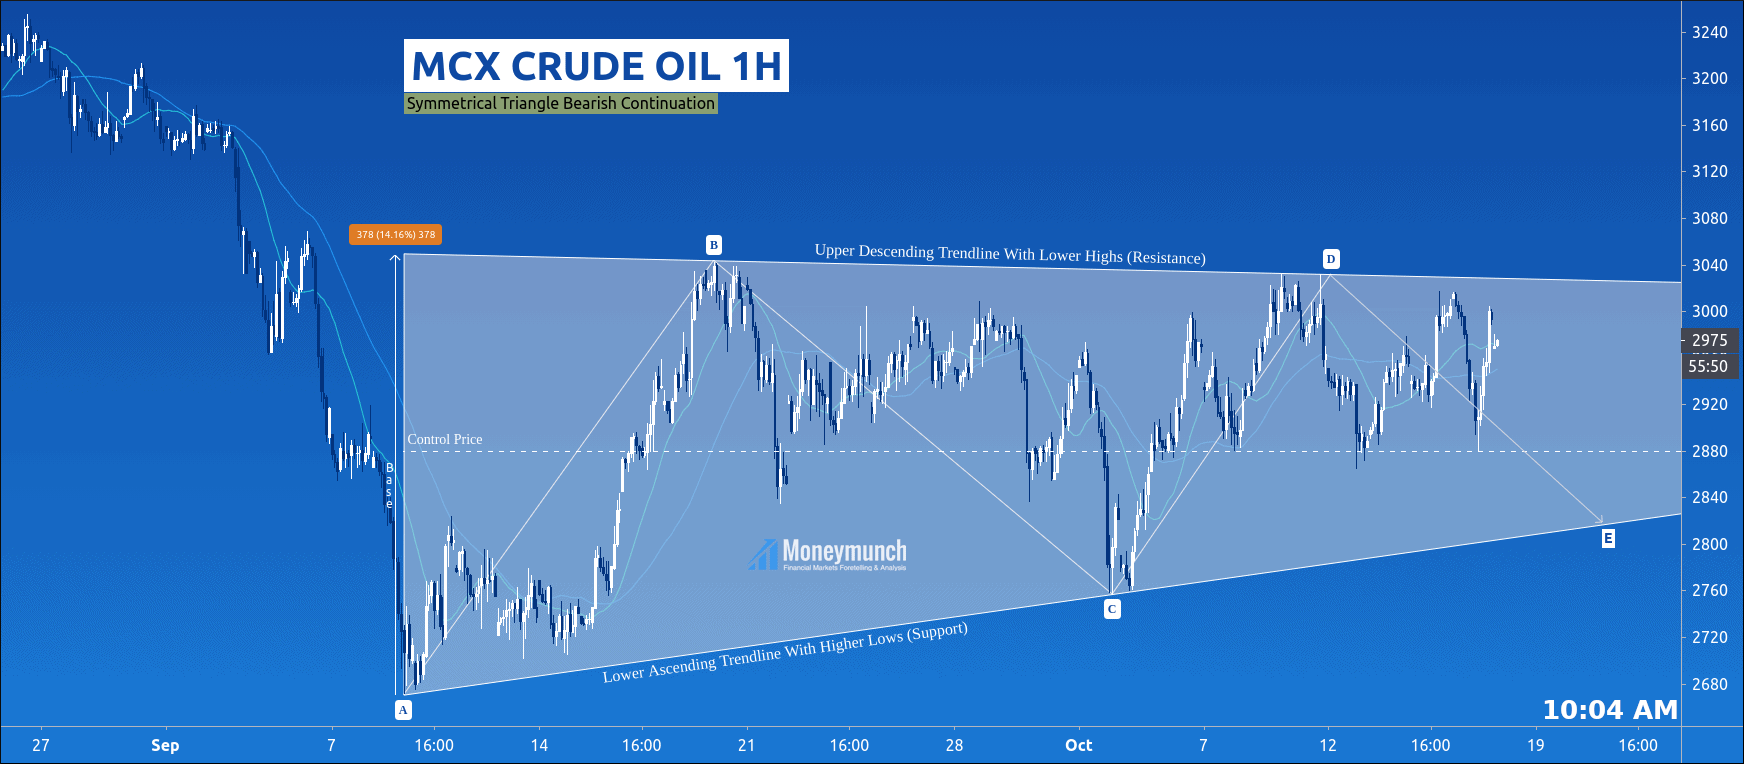
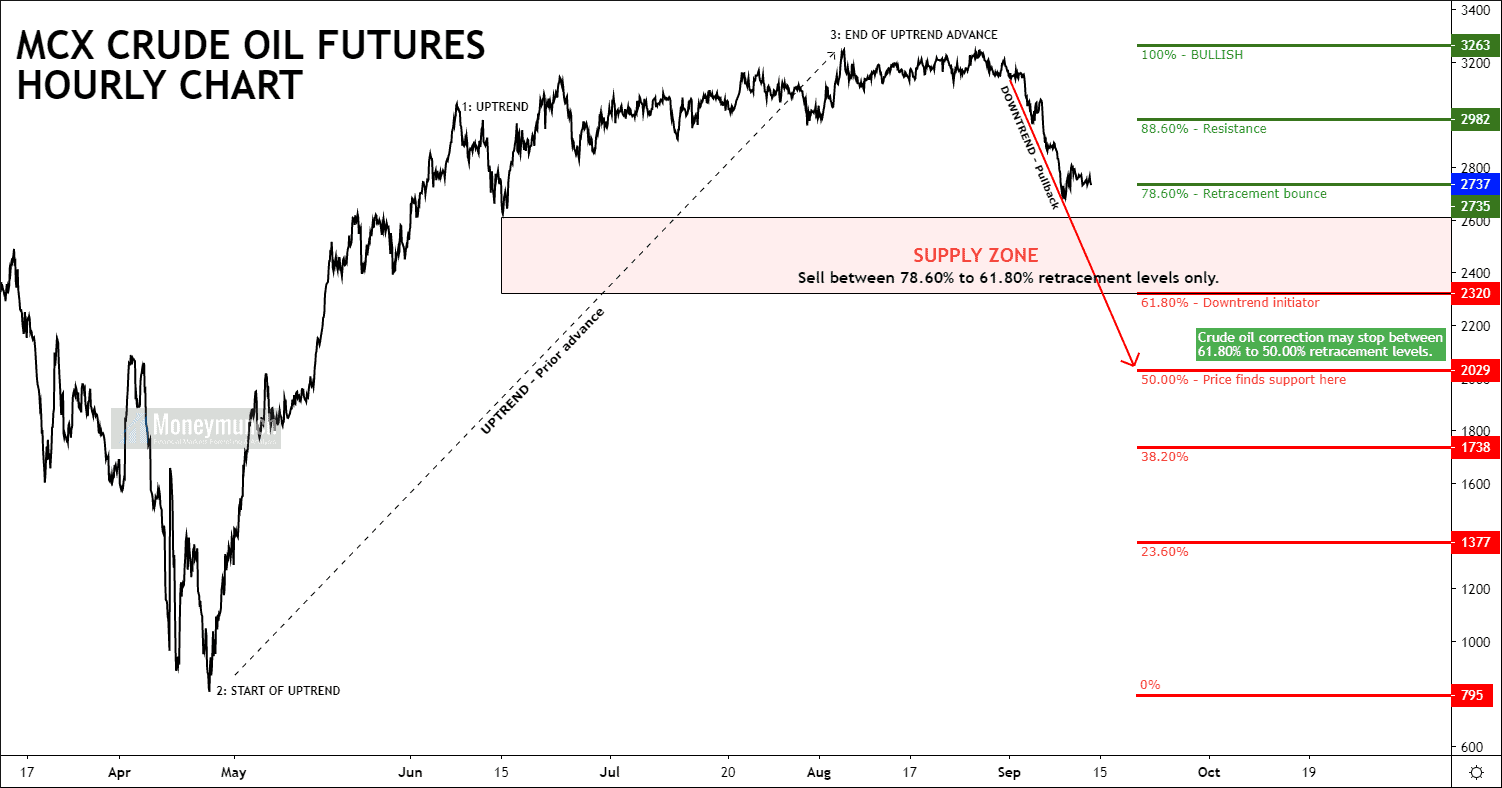
MCX Crude oil has made a symmetrical triangle pattern, and that indicates a bearish continuation. At present, its price is moving inside the triangle pattern. That’s a consolidation area. The prices will keep playing sideways here.
Intraday traders can sell or buy based on control price. The last expected stop is at E. So, we may see crude oil at/below 2840 – 2820 level.
FOR SHORT-TERM INVESTORS:
This symmetrical triangle base range is 378 points. So, the game will begin whenever crude oil will breakout the triangle pattern.
Upper breakout’s targets: 3130 – 3200 – 3280+
Downward breakout’s targets: 2610 – 2500 – 2460
Beware of tail, fakeout, and excess. Accurate entry-level, target and stop-loss is available for the premium members only.
Yesterday I had an updated intraday trading call on Zinc. It has made a high of 194.55 level and closed at 194.35. Will it reach the first & second target or not?
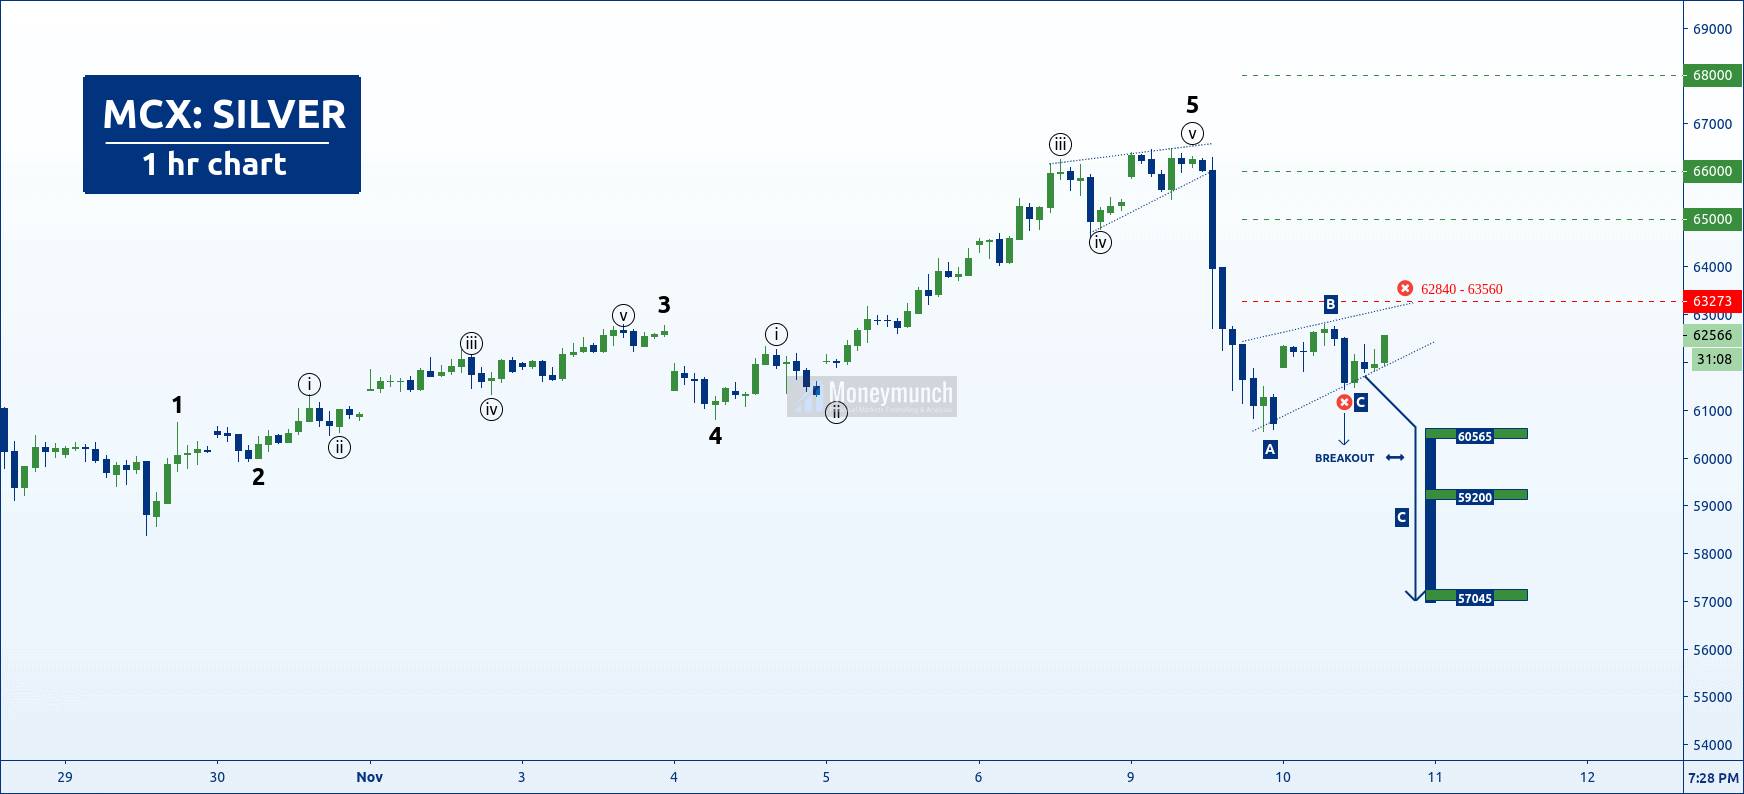
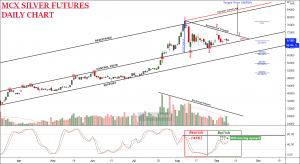
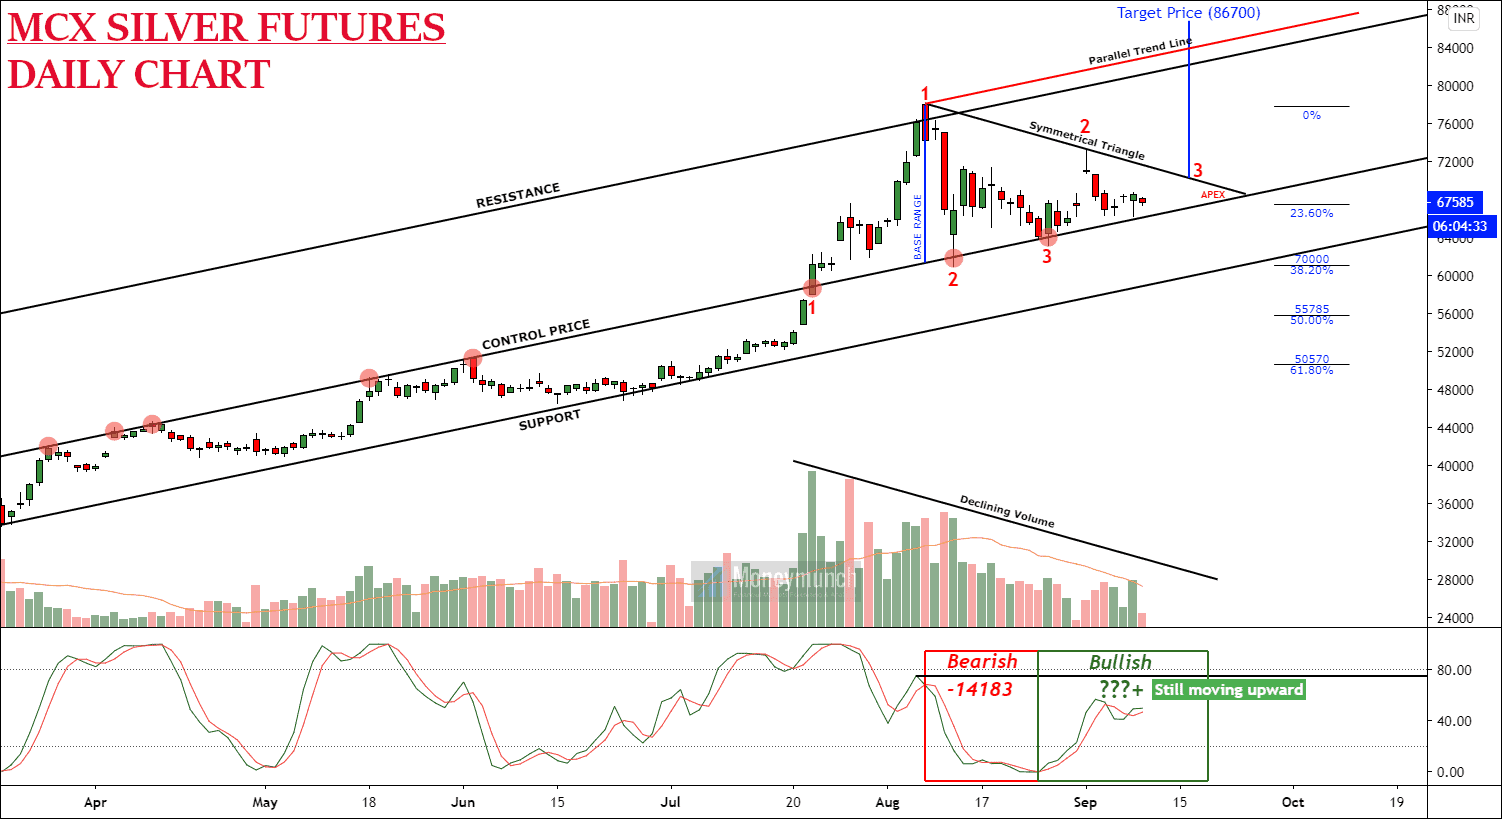
I had updated an intraday call on the silver the day before yesterday while its price was running nearby the 61500 levels. It has reached the first target before collapsing. So, what are you expecting ahead?
Will silver hit the next targets or keep falling? To become a subscriber, subscribe to our free newsletter services. Our service is free for all.