Have you traded MCX Silver’s research report?
Click Here: Commodity Silver’s MOON to EARTH Journey May Start
 BEFORE
Enhance your MCX silver trading skills with Moneymunch’s free silver trading tips and market analysis. Stay updated on the latest commodity market trends and make profitable trades.
Have you traded MCX Silver’s research report?
Click Here: Commodity Silver’s MOON to EARTH Journey May Start
BEFORE

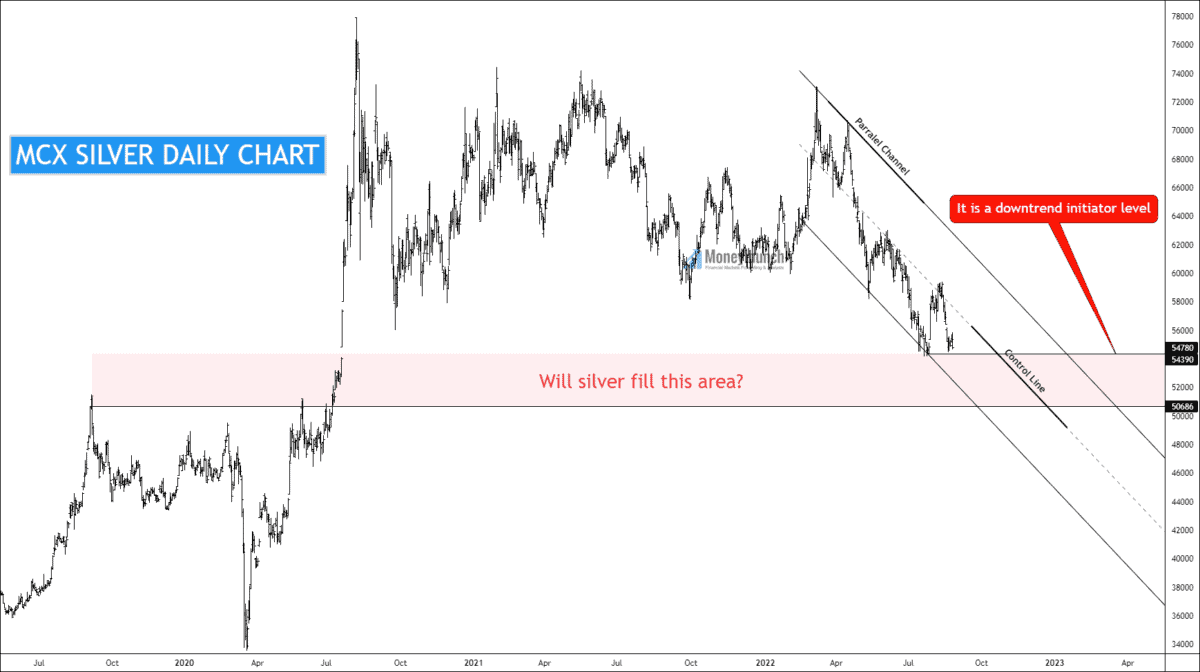
XAGUSD investors must fear to 18.305 level. At the current stage, it is strong support.
And if that happens with a breakout, be ready for the 17.00 and 16.00 levels because it’s a very crucial point for short-term investors.
My point is to explain XAGUSD first because it closed at 18.902, and whenever it comes to hit the 18.305 level at that moment, the MCX silver will try to fill the following area (see the chart below).
Continue reading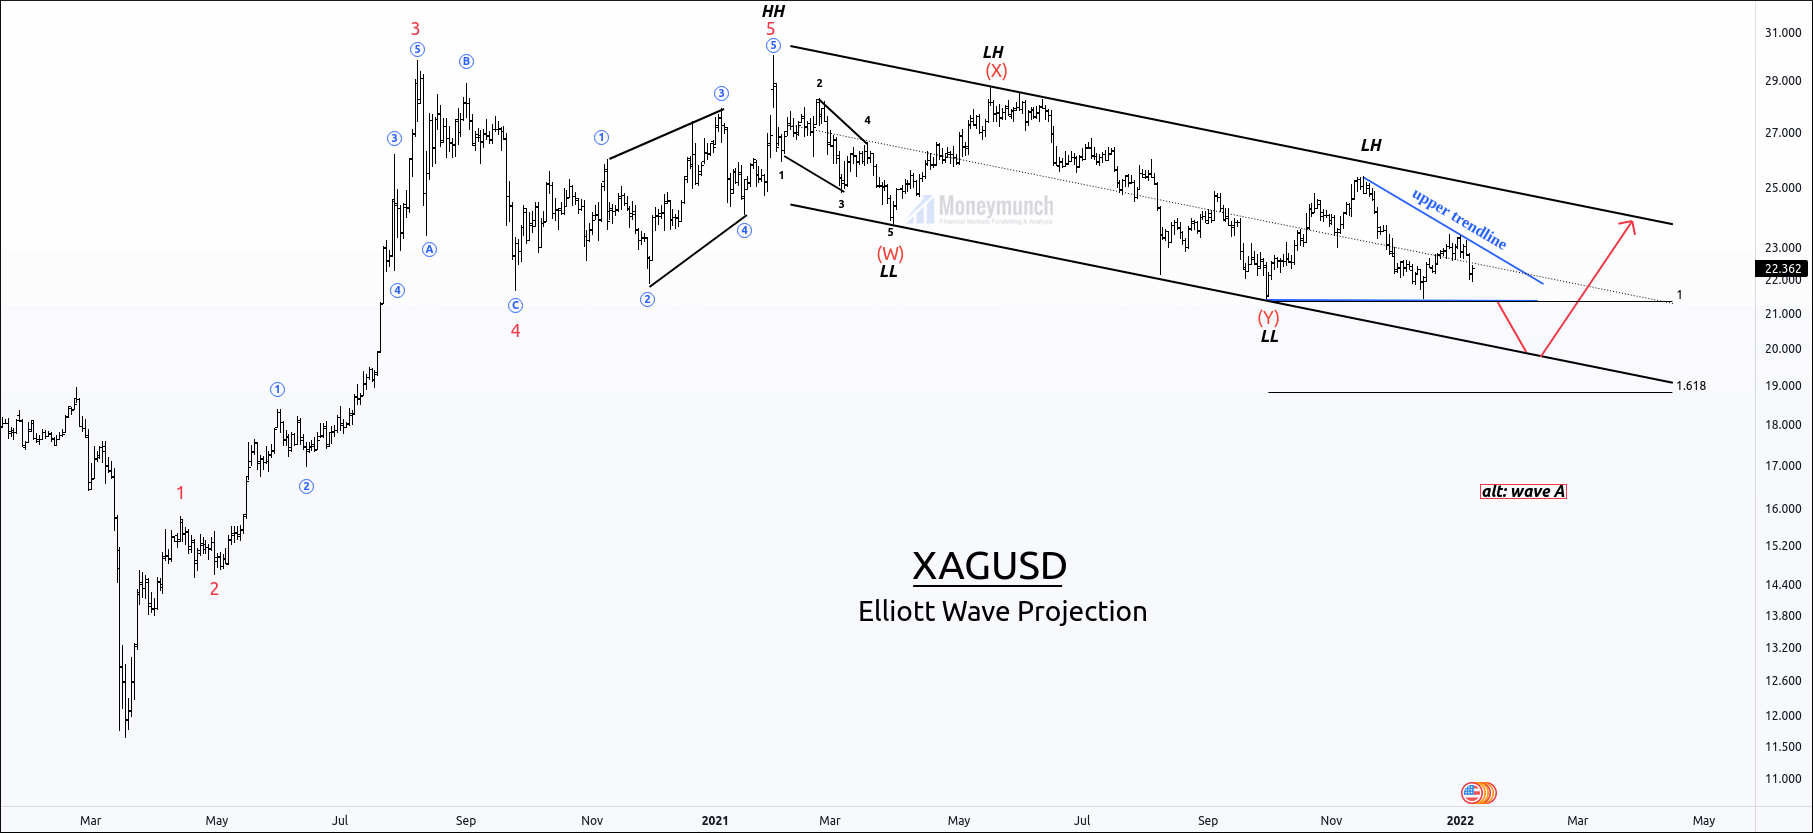
Silver(XAGUSD) has formed a downtrend channel for more than 48 weeks. Price has made a high of 30.03, and sellers entered the market.
Price Action Perspective:
Price has made a series of Lower Highs and Lower Lows, and the control line gives nine touches.
According to Dow theory, if the price breaks the previous LL, it will make a new LL. The upper band & lower band has provided strong reversals to the price.
After breaking the LL, if the price gives a breakout of the downtrend channel, it indicates the worst fundamentals. And if the price gets reversed to create the lower band of the downtrend channel, the price will march to the upper band touch.
Elliott Perspective:
Price has constituted a corrective structure, where price has completed double zigzag(w-x-y).
It will create the last leg wave Z in order to complete the Triple correction. After making the last leg Z, silver will start a five-wave impulsive wave.
To become a subscriber, subscribe to our free newsletter services. Our service is free for all.
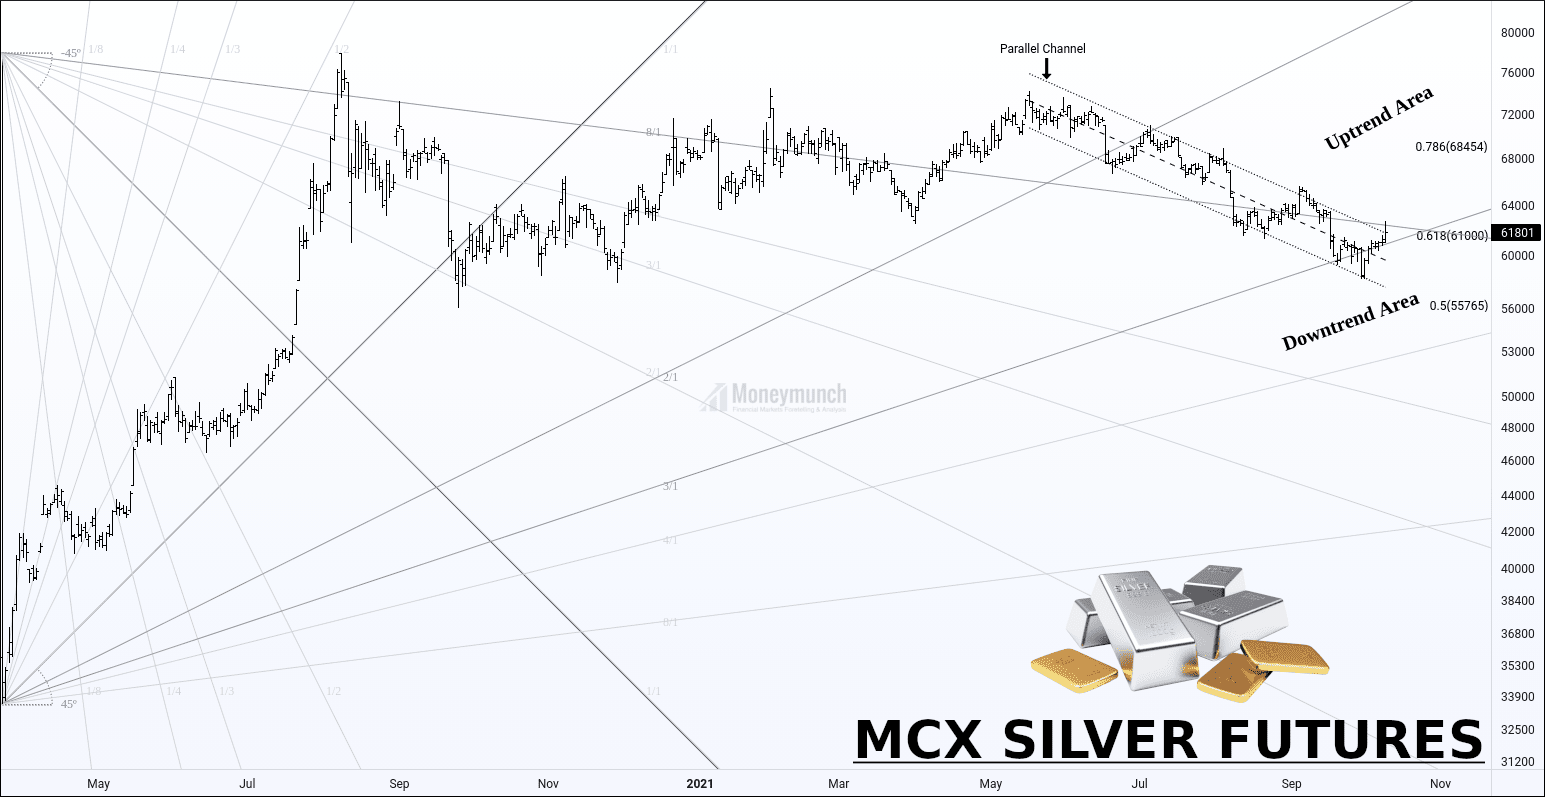
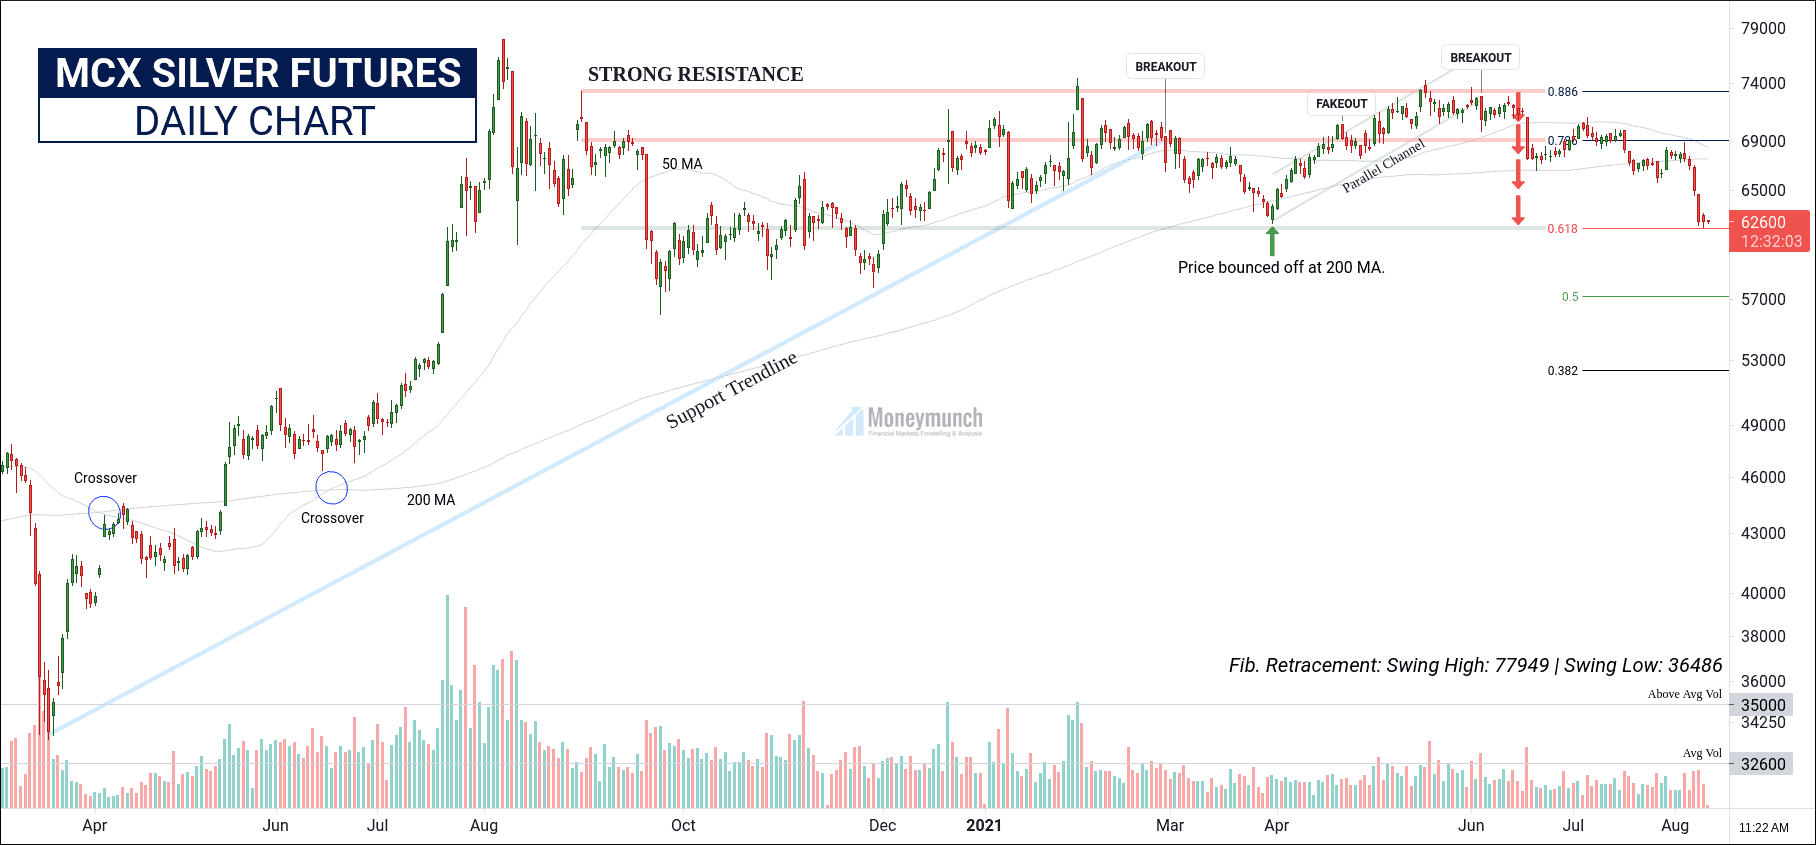
Currently, silver has jumped back into the uptrend area. It has also broken the parallel channel in the last trading session. But, the buy is not confirmed yet. The uptrend can be resume if it remains above 0.618 of retracement level and 3/1 & 8/1.
If that happens, then you can buy for the targets of 63900 – 65100 – 65960 – 68454.
What happens if it’s fake-out? That’s a straightforward scenario on the above chart. MCX silver futures will come under the control of sellers in the downtrend area. It will fall nonstop for the targets of 59960 – 59400 – 58600 – 55765.
 In the previous week, gold has made a high of 47370 (+531 / +1.14%) and closed at 47037.
First, did you read my last gold outlook report? If not, click here and read it now.
As I had written, “If gold does breakout of 46860 level, then we may see 47276 – 47600 – 47960+. Don’t get confused! You have to watch out the level 46860 for an uptrend, and the closing price below the Doji candle indicated a bearish trend signal”.
At present, gold is under buying pressure. We will see the remaining targets soon.
Condition: it has to break/close above to 0.618.
 How many of you read the 27 Sep technical report of Nickel? If you did not read then click the below link:
MCX nickel’s Elliott wave projection (Target 1570)
Nickel has started rolling upward to complete the 5th wave. Be ready to see 1506 – 1532 – 1550 – 1570 target levels.
 Did you read my Aluminium report? If not, then click the below link:
Aluminium Should Run Up To 240+ In Next 30 Days
I had written, “aluminium has made an all-time new high of 236.3 and declined. It can dig more upside from here. Before that, we may see retesting of 229 – 226.8 levels.
Afterward, it can move for the target of 233.6 – 236 – 238+.”
Aluminium has tested 226.8 on 30 Sep by making a low of 226.1. Afterward, it started moving forward and touched all targets.
If you’re still losing money in MCX trades, nobody can help you. To become a subscriber, subscribe to our free newsletter services. Our service is free for all.
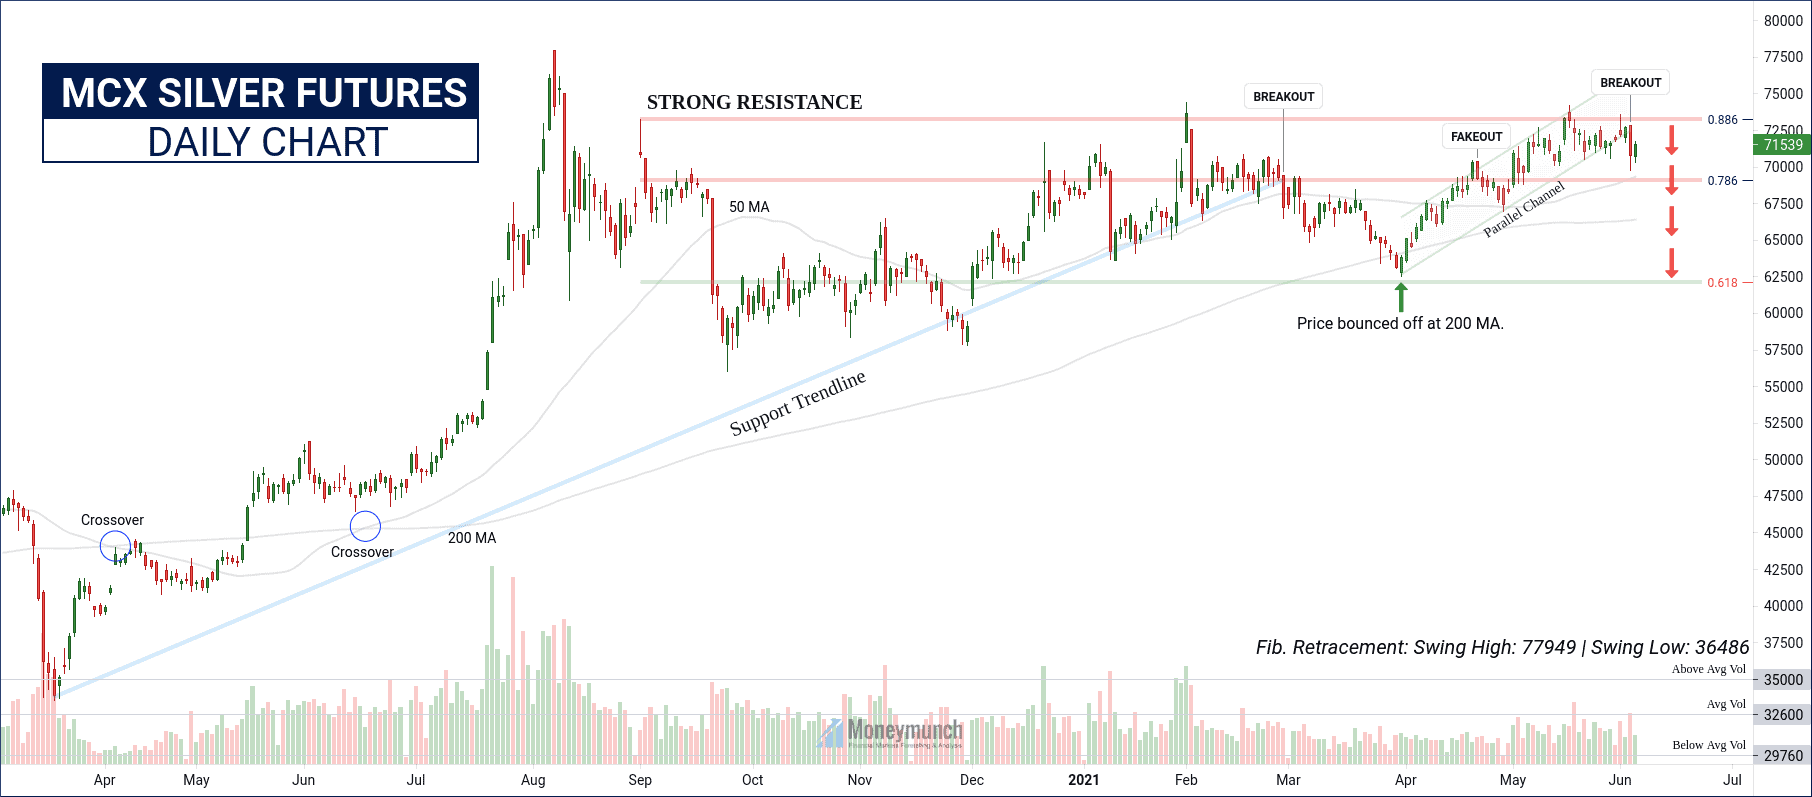
According to the previous data, it has breaks 2021’s support trendline. But the price has bounced off from the 200 moving average. And it’s not crossing the 0.886 value of retracement. Hence, at the present silver trading range is between 73222 – 69076 levels.
This week, silver may collapse up to 0.786 ( TP: 70660 – 70000 – 69200 ). And hurdle is 73222 level…
To become a subscriber, subscribe to our free newsletter services. Our service is free for all.
 Unlock This Article