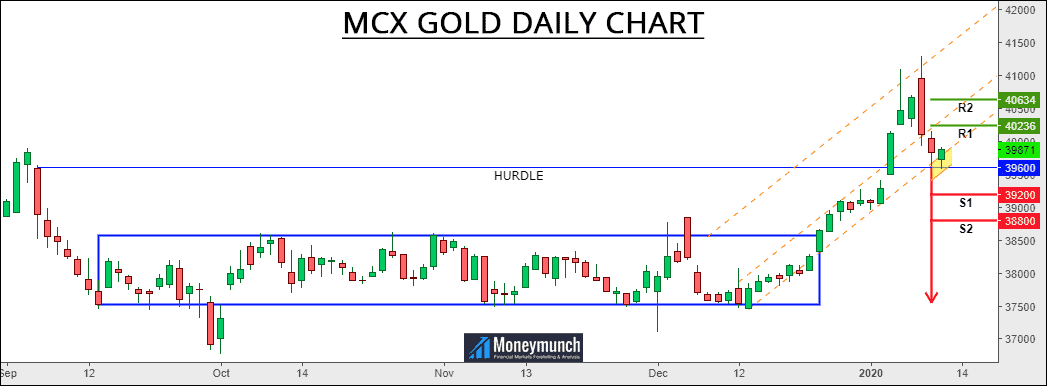
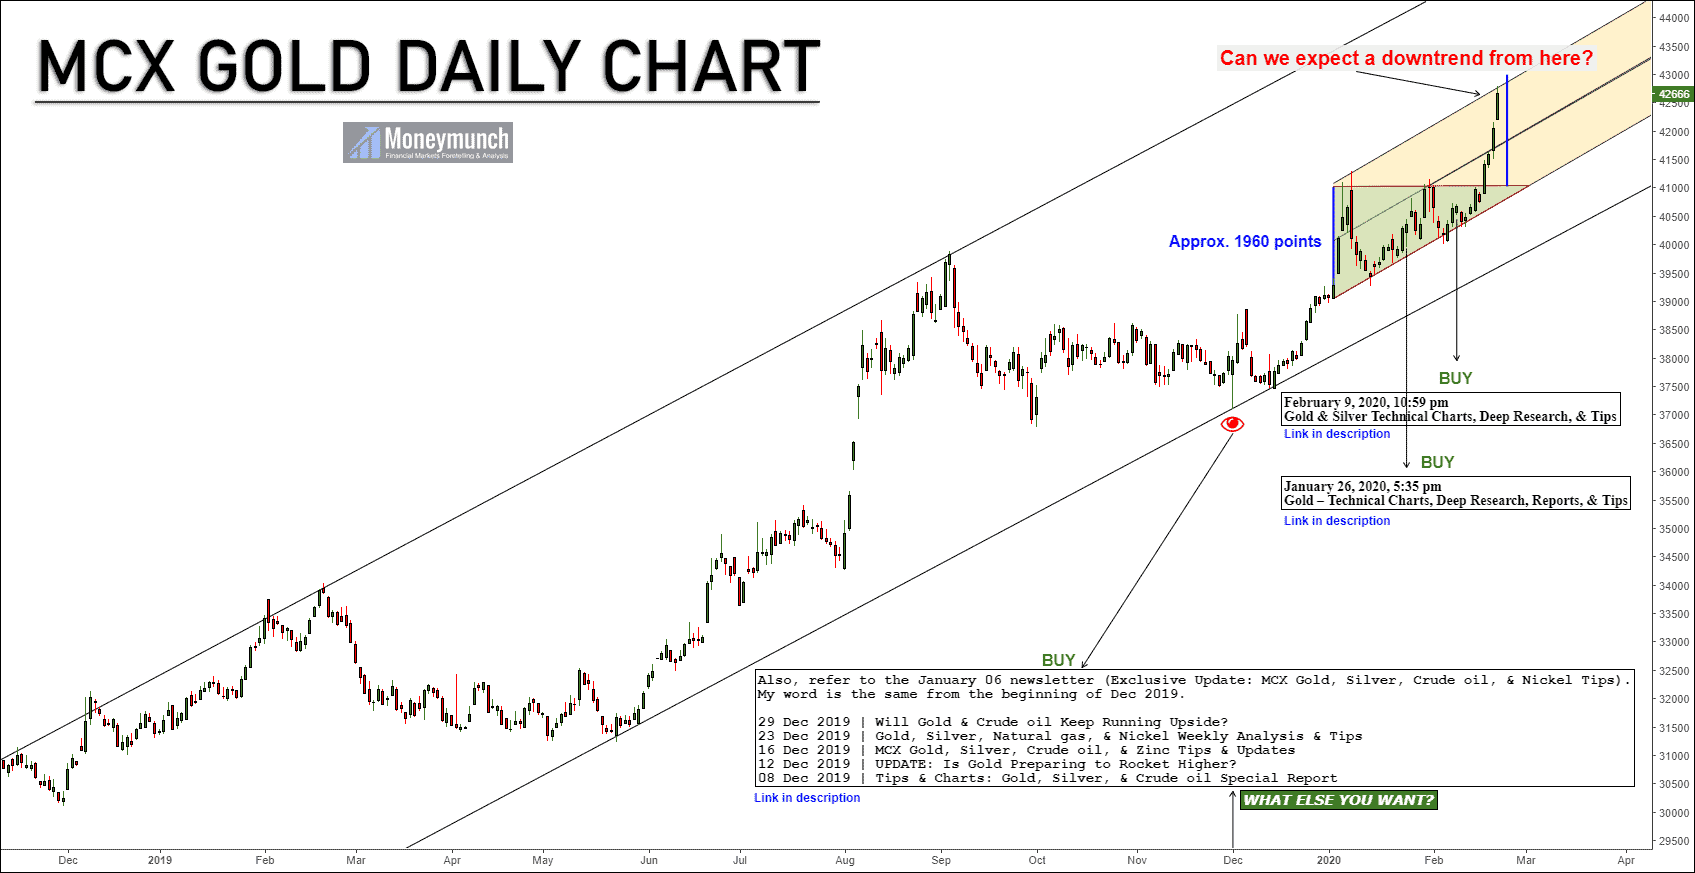
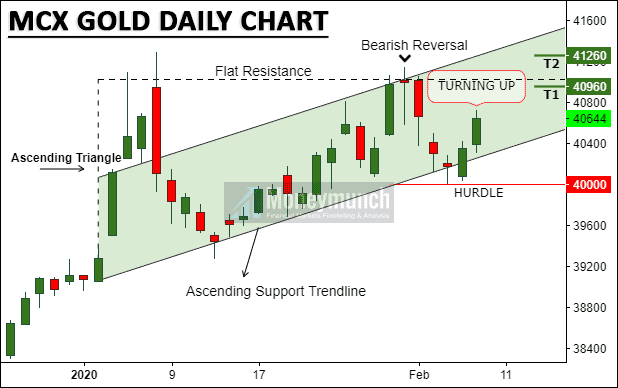
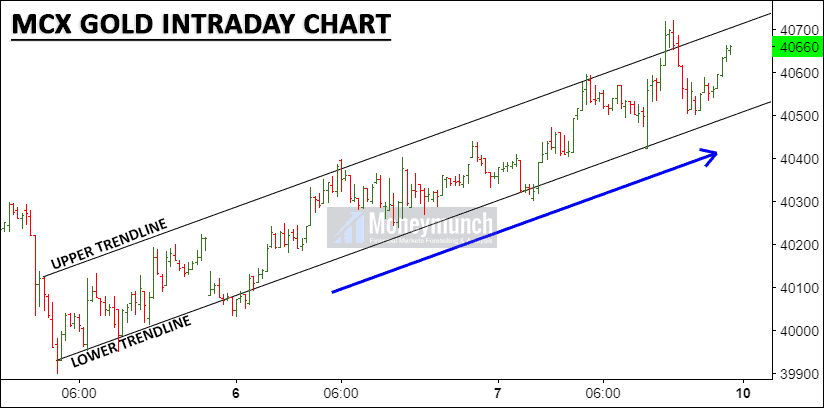
Gold Price Short Reversal in Progress
As per the chart, MCX Gold will keep moving upward for 45500 to 46000 after a short reversal (43800 – 43500 levels).
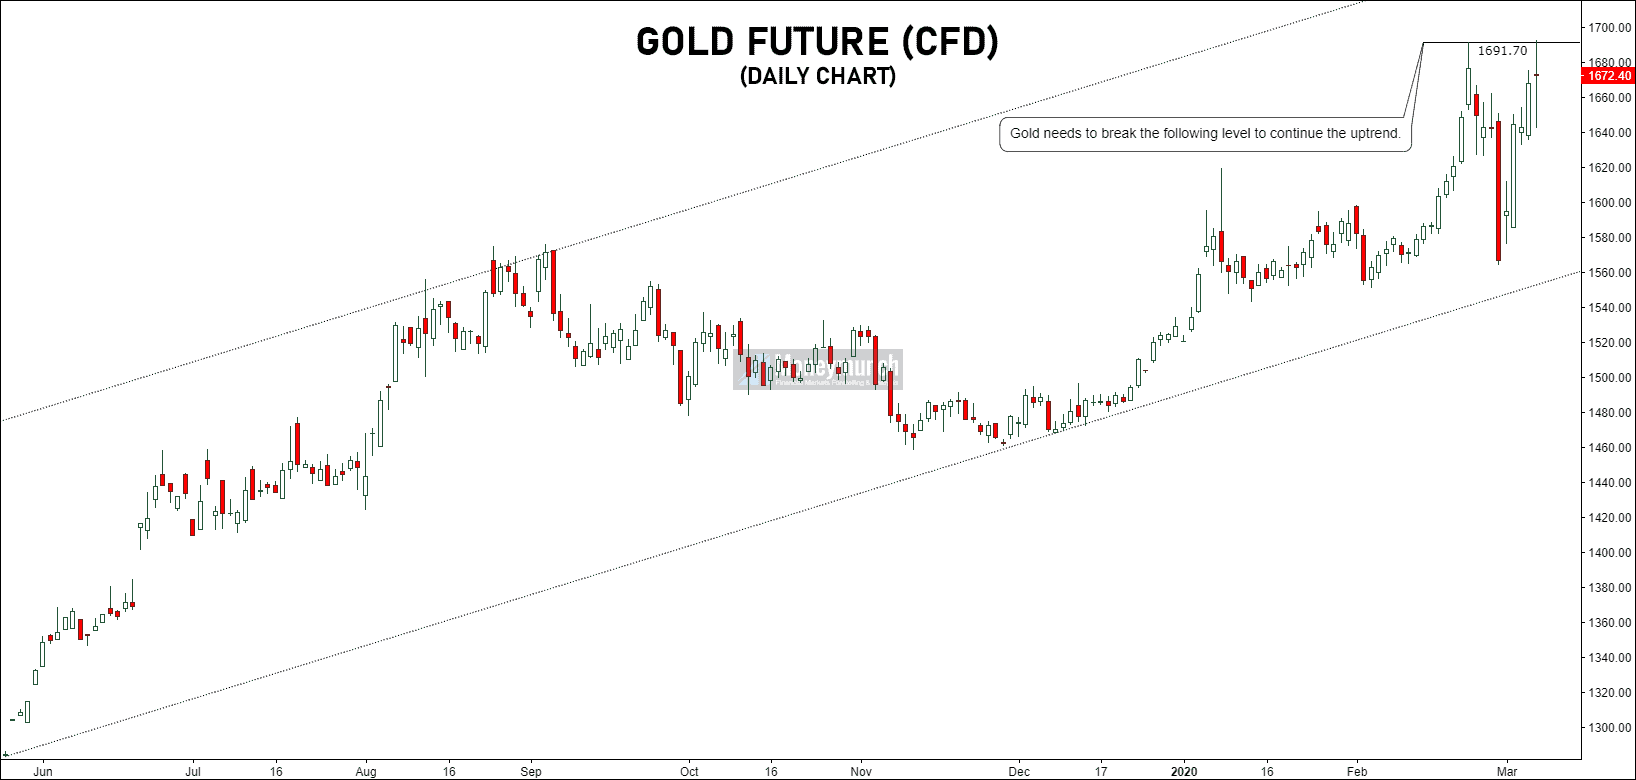
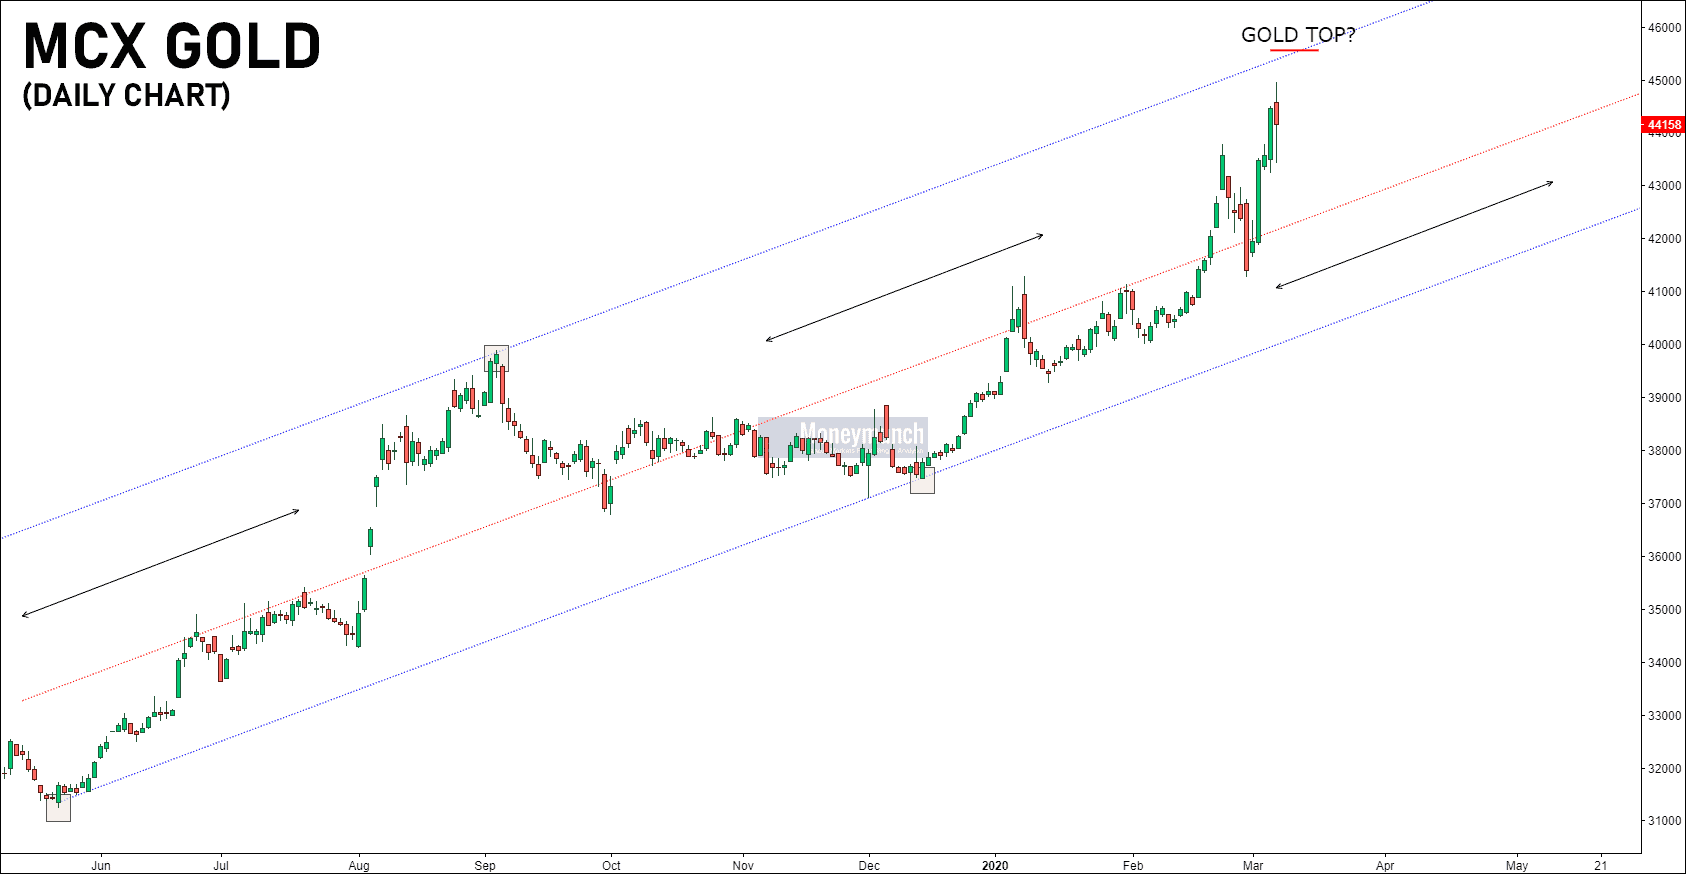
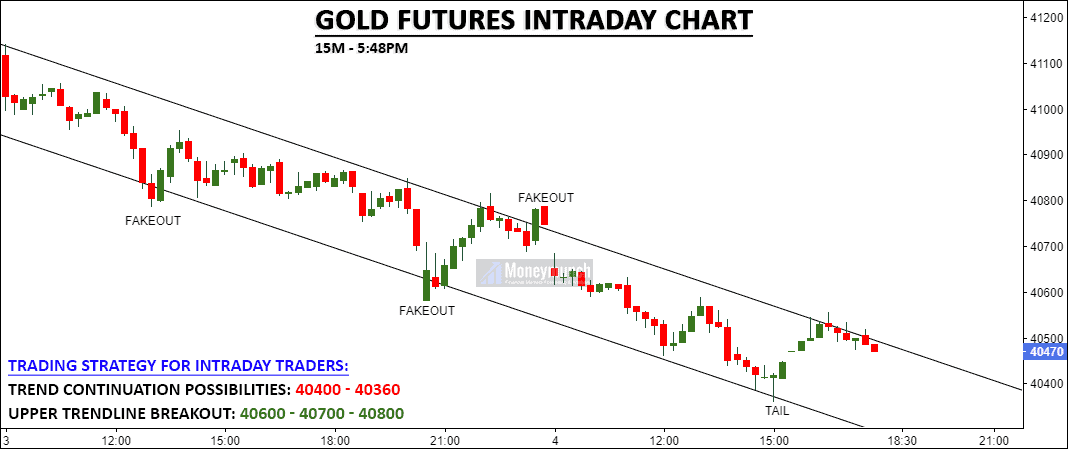
Although, COMEX Gold futures (CFD) need to break out/close above the last candle to continue the uptrend (for 1720 – 1740+ levels).
For a short period, we can expect 1650 – 1600 levels.
Remember, Never sell above 1691.7 level.
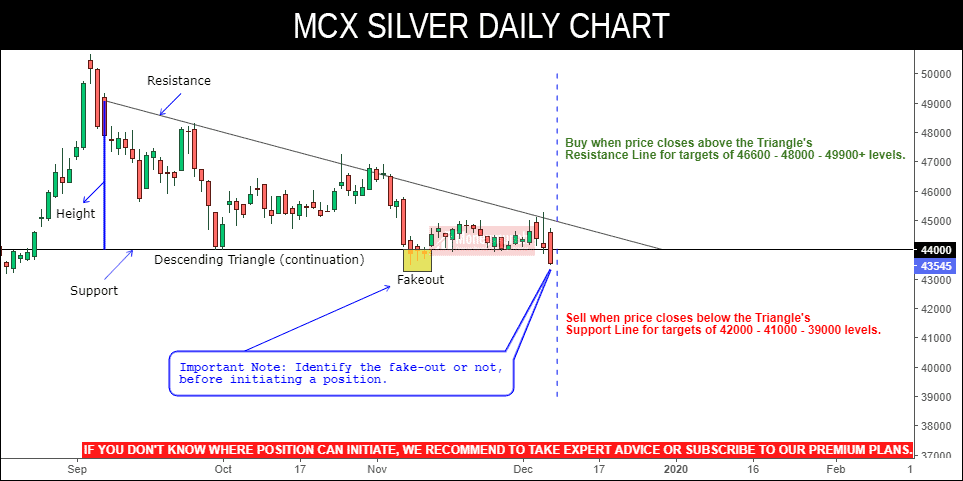
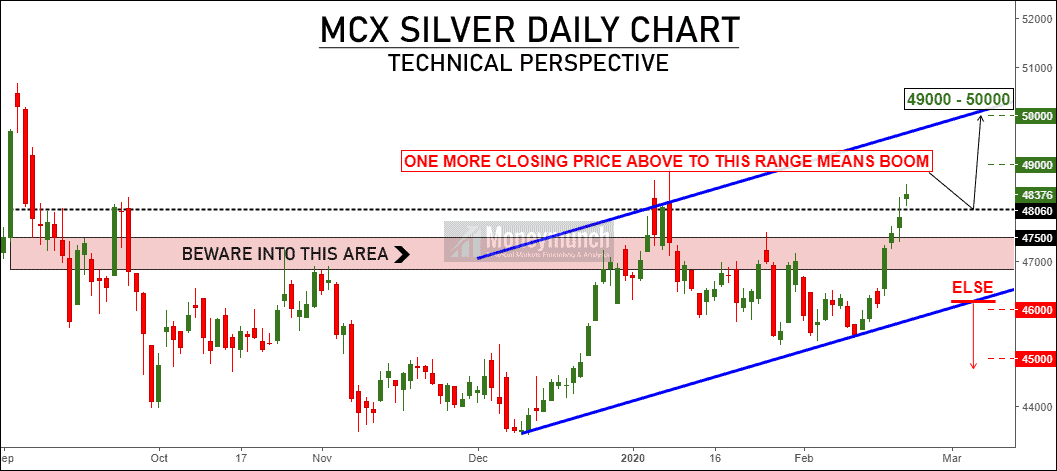
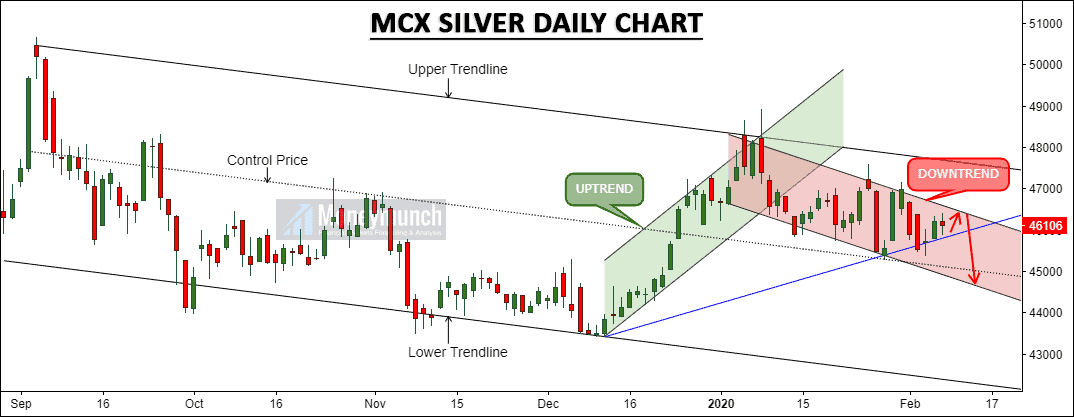
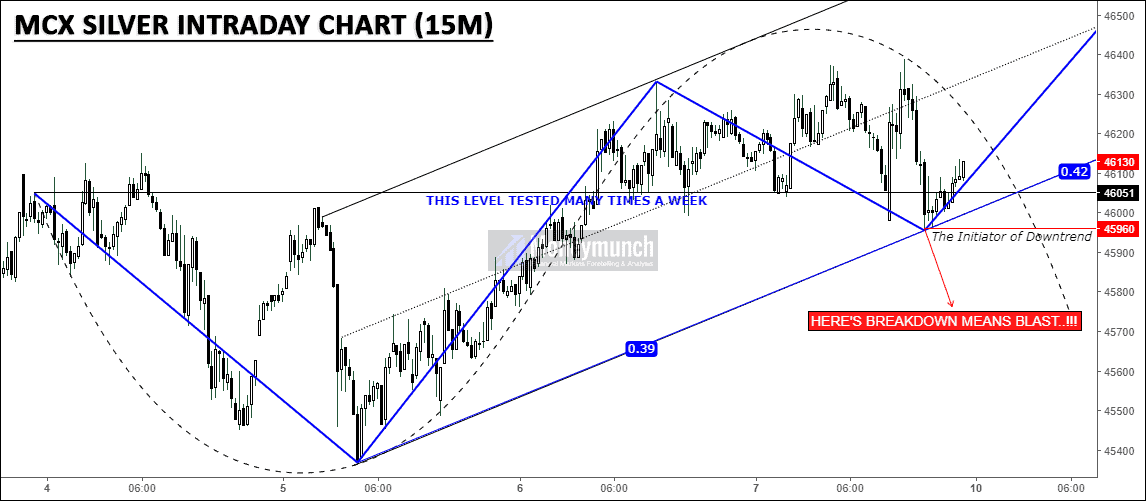
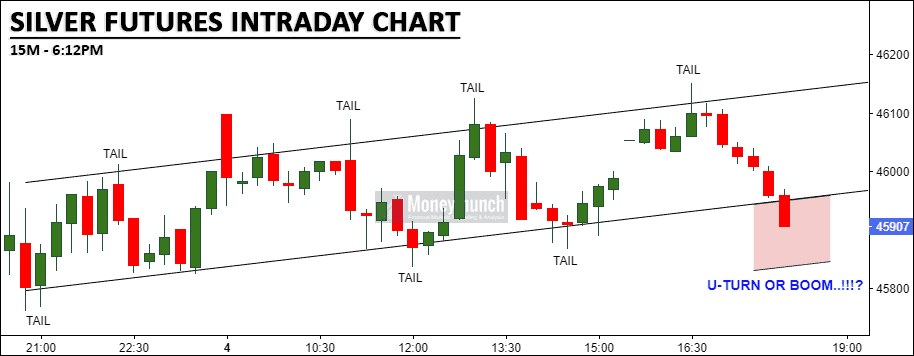
Trading strategy for Silver
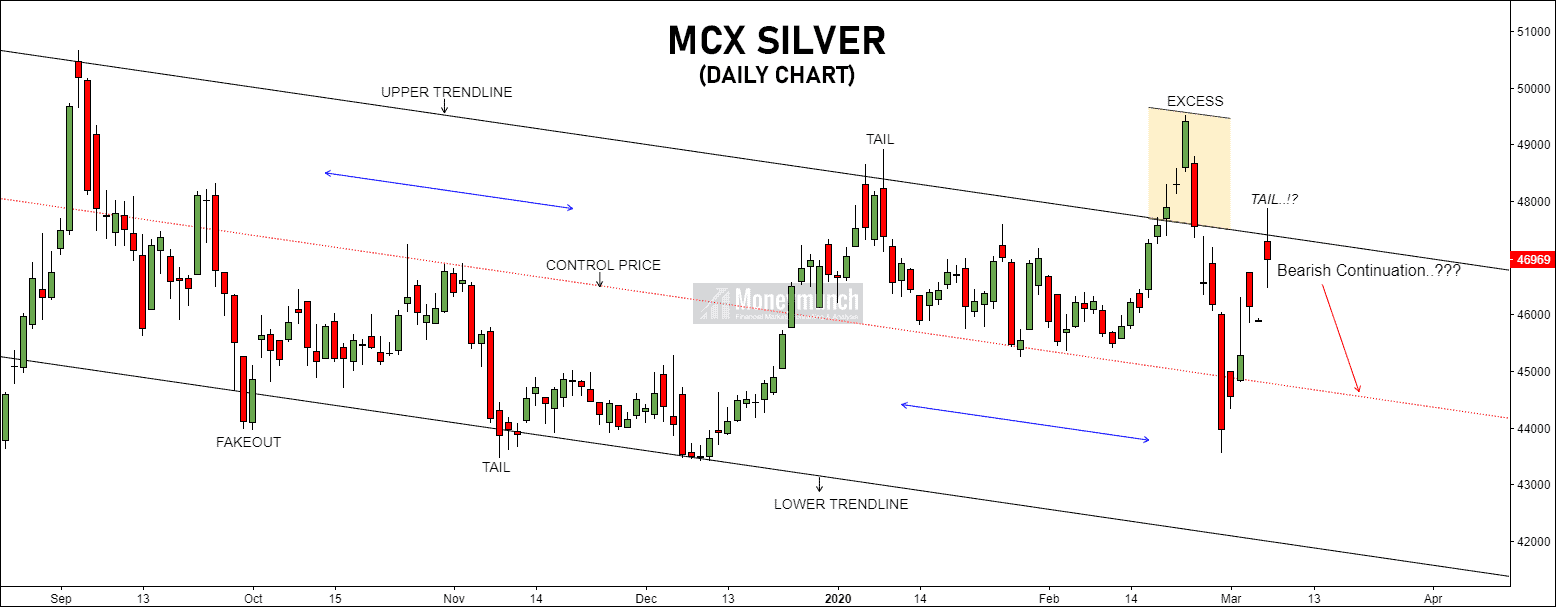
Upper trendline breakout will initiate buying pressure for 48000 – 49000 levels. And under the upper trendline, 46000 – 45000 – 44600 expected.
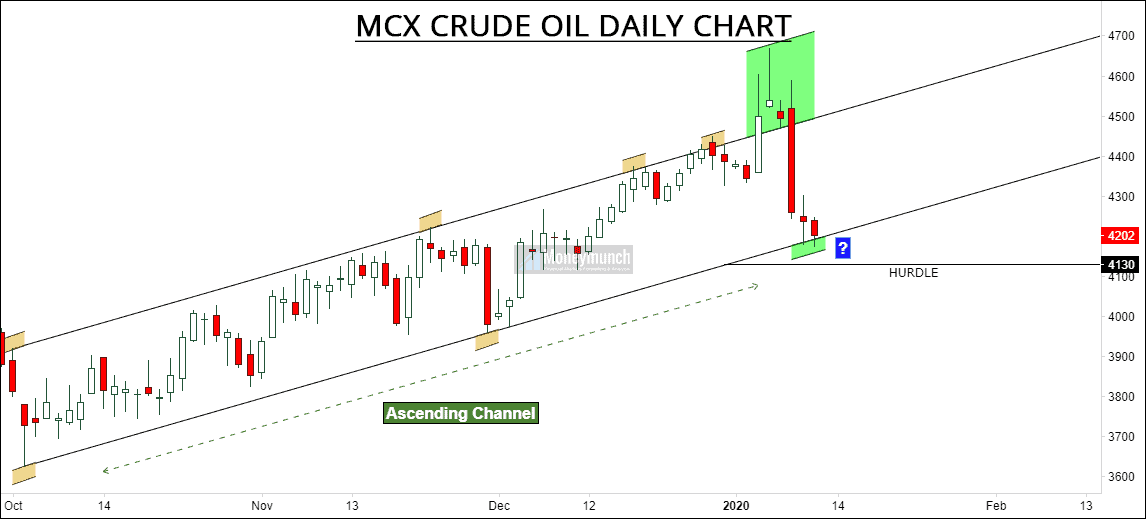
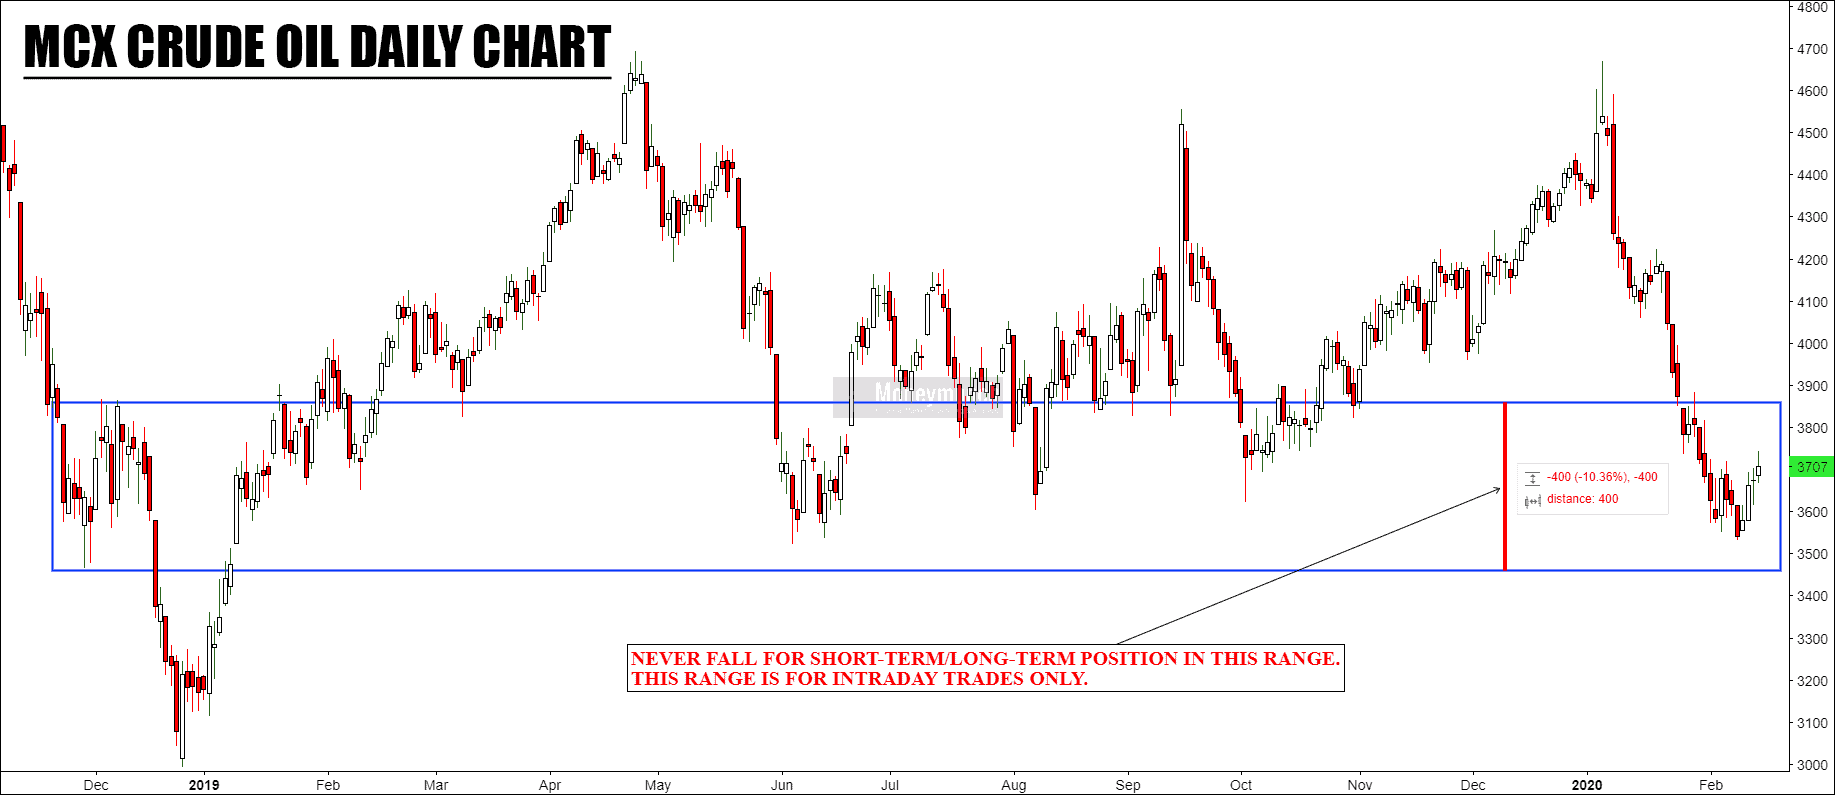
Crude oil Preparing to Hit the 2018 Year’s Low?
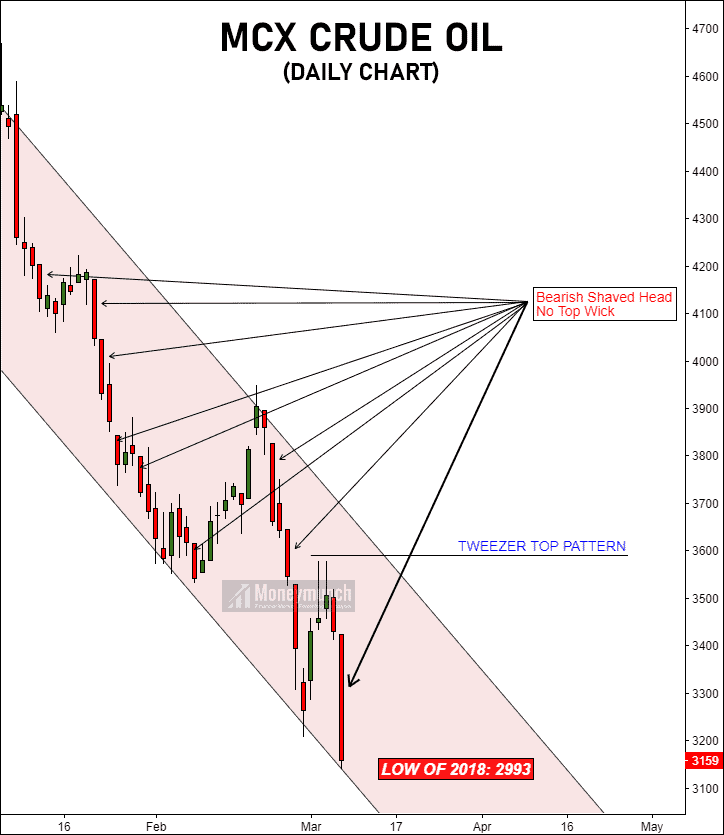
Bearish shaved head candle indicating continuing the downtrend for 3100 – 3000 below. The first rule is, the next candle should not be positive. Otherwise, it will start recovering the previous loss (3300 – 3400).
To become a subscriber, subscribe to our free newsletter services. Our service is free for all.

 Unlock This Article