 Unlock This Article
Only subscribers can read the full article. Please login to read the entire article.
NSE NIFTY Trade Setup For Subscribers
To become a subscriber, subscribe to our free newsletter services. Our service is free for all.Continue reading
Looking for reliable and free nifty trading tips on Nifty Futures or Options, Bank Nifty Futures or Options, and Nifty Indices? Look no further than Moneymunch! We provide intraday and positional trading calls, technical analysis, research reports, and daily or weekly charts to help you make informed trading decisions in the stock market. Subscribe now and stay ahead of the game!
NSE NIFTY – Swing Setup For Subscribers
Did you read NSE Hindoilexp research report?
Click here: NSE HINDOILEXP: BULL TRAP OR A SYSTEMATIC RALLY
 BEFORE
Did you read our Nifty, DALBHARAT & TITAN Research report?
Click Here: NSE NIFTY, TITAN & DALBHARAT Wave Analysis
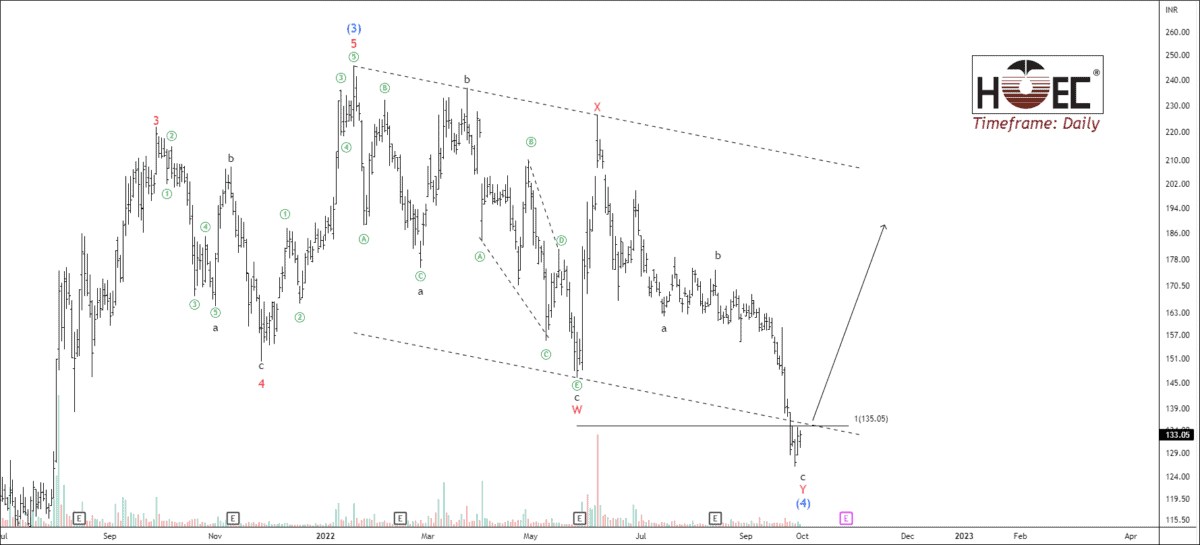
NSE NIFTY was looking weak in the daily timeframe chart. It was preparing for a retracement to confirm its trend. SGX was also giving a bearish signal.
9:15 AM: Nifty opened at 17149 and made a low of 17064. It touched our final level of 17075.
Everything happened as expected. Further information will be available for subscribers only. (To become a subscriber, subscribe to our free newsletter services. Our service is free for all.)
It was a setup of DALBHATAT. The first target got hit in just 4 minutes.
I had mentioned clearly,” Traders must wait for the break out of the range 1520 – 1540. If the price sustains below 1520, traders can sell for the following targets: 1507 – 1490 – 1481.”
Timeline:
I will update further information soon.
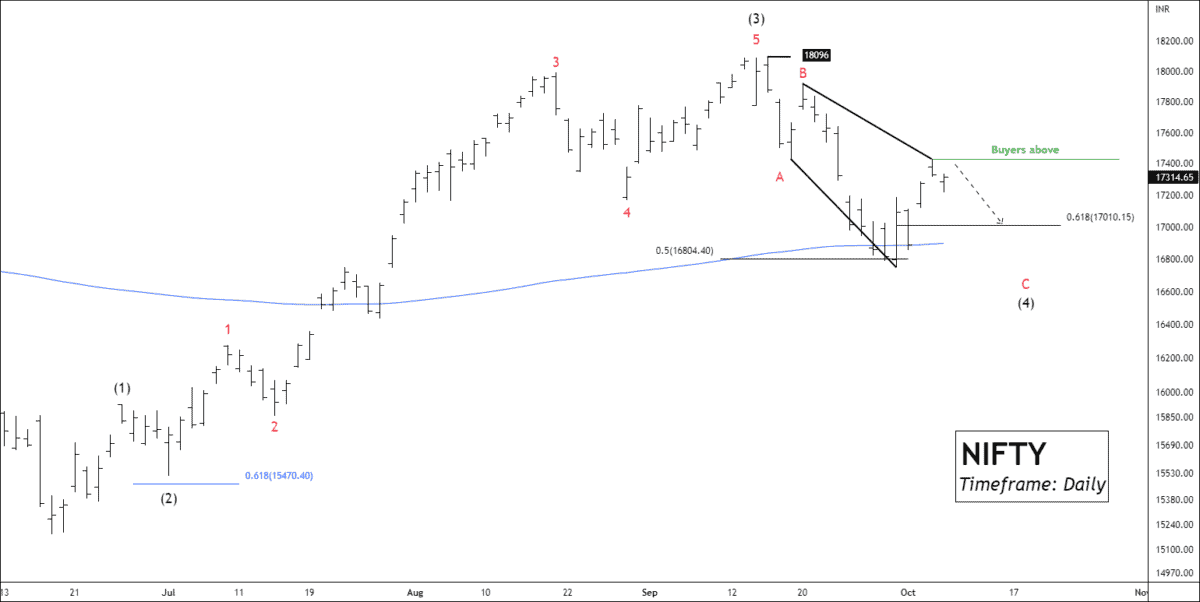
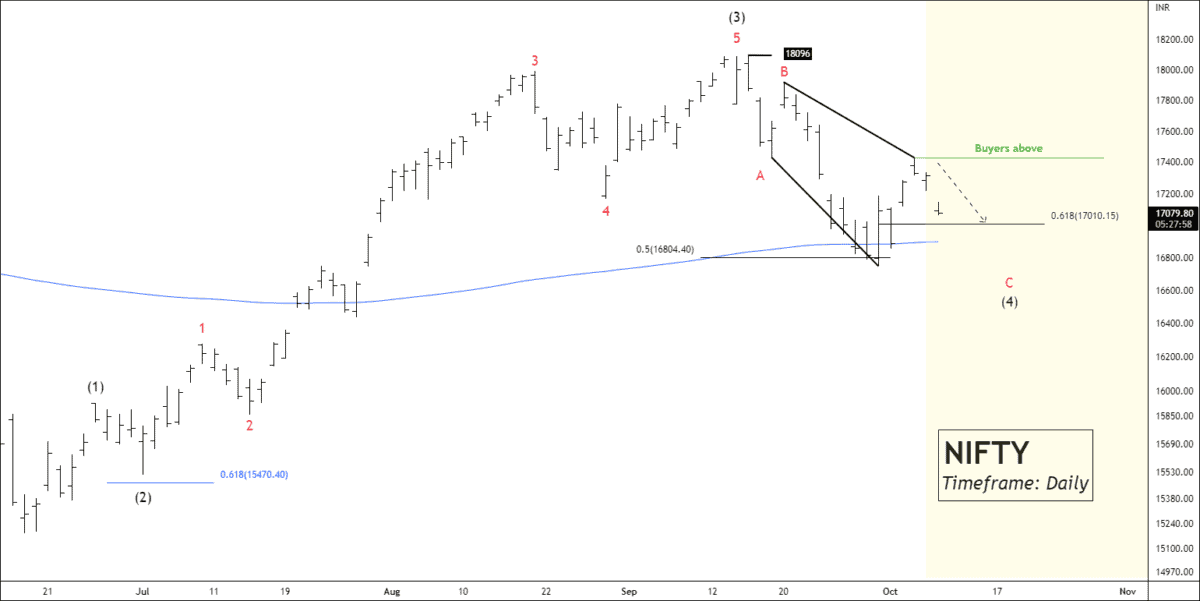
NIFTY has been forming corrective waves for more than two weeks. After making a low of 16647, nifty couldn’t hold above 17450. If Nifty wants to continue its bullish momentum, the price must sustain above 17450.
Even if nifty has bullish sentiments and is preparing for impulsive wave 5, it will take enough retracement to generate more buyers. If nifty sustains below 17300, traders can trade for the following targets: 17232 – 17135 – 17075.
In the case of bearish momentum, the breakdown of the lower low will lead the price to an extreme low. It is not advisable to buy blindly, but to wait for the bottom if you are a buyer/investor.
Subscribers will have excess information. (To become a subscriber, subscribe to our free newsletter services. Our service is free for all.)
TITAN is at 12-week old resistance. Price couldn’t break the 2755 level with five attempts.
Price ended up falling to find enough demand. If the price fails to break 2755, traders can sell for the following targets: 2689 – 2634 – 2583.
There is a low possibility for a new high for TITAN. But we should look at every possible outlook. If the price sustains above 2755, traders can buy for the following targets: 2770 – 2825.
Dalmia Bharat is trading below 200 EMA, which signals a bearish movement. The RSI of the price is below 42 points. Price has reached a crucial support level of 1520.
Traders must wait for the break out of the range 1520 – 1540. If the price sustains below 1520, traders can sell for the following targets: 1507 – 1490 – 1481.
As I mentioned, the price will be at a powerful support level of 1520. If sellers fail to stop bulls from sustainably above 1540, traders can trade for the following targets: 1554 – 1569 – 1587.
In addition, Dalbharat has formed a head and shoulders pattern, and the neckline is 1518.
We will update further information soon.