Have you read the Previous report on nifty and bank nifty?
Click Here – NSE NIFTY & BANKNIFTY OUTLOOK FOR INTRADAY TRADERS
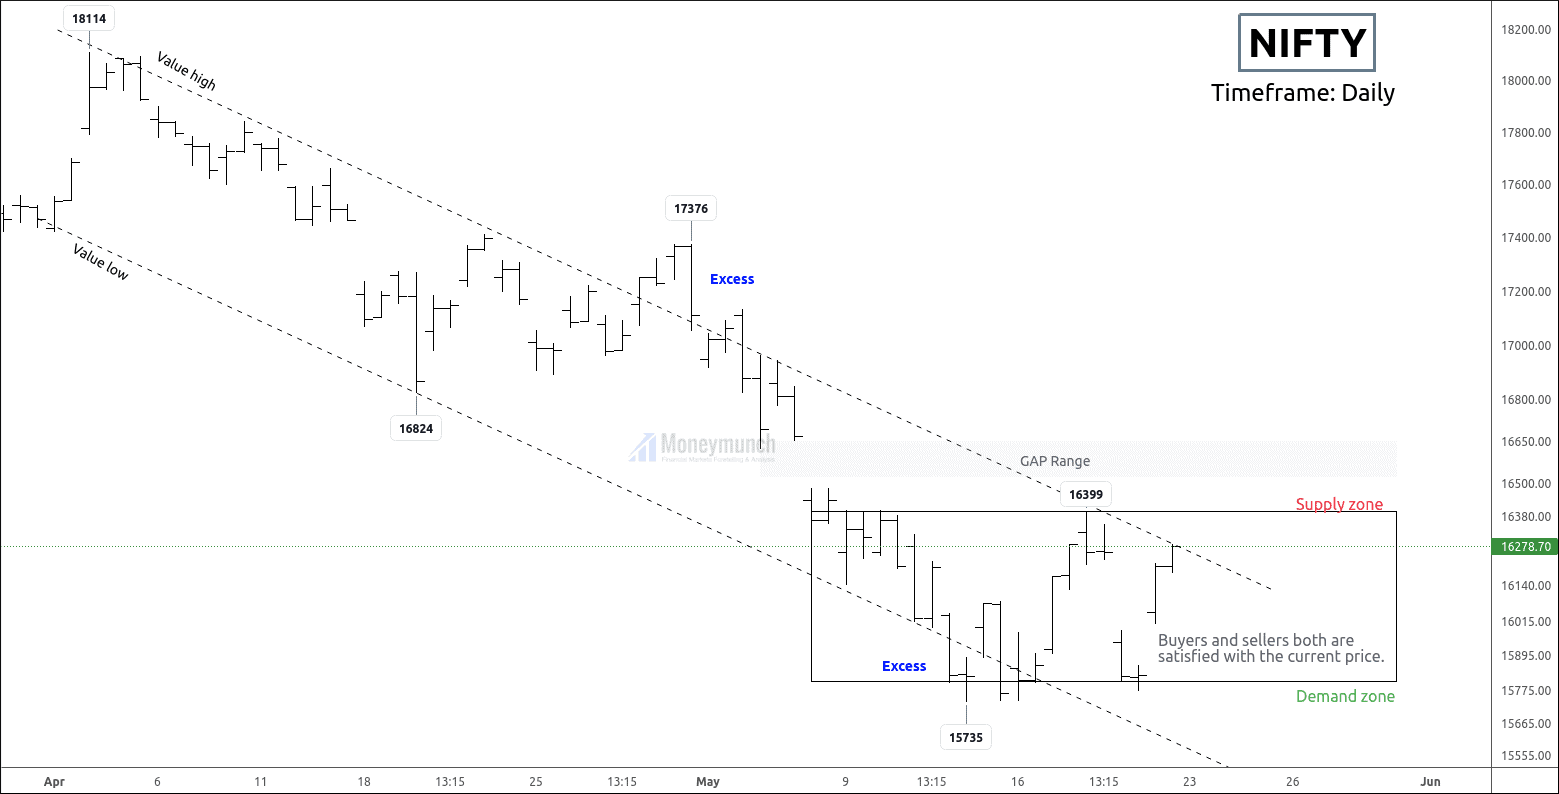
NSE Nifty Has unfolded Bearish Structure
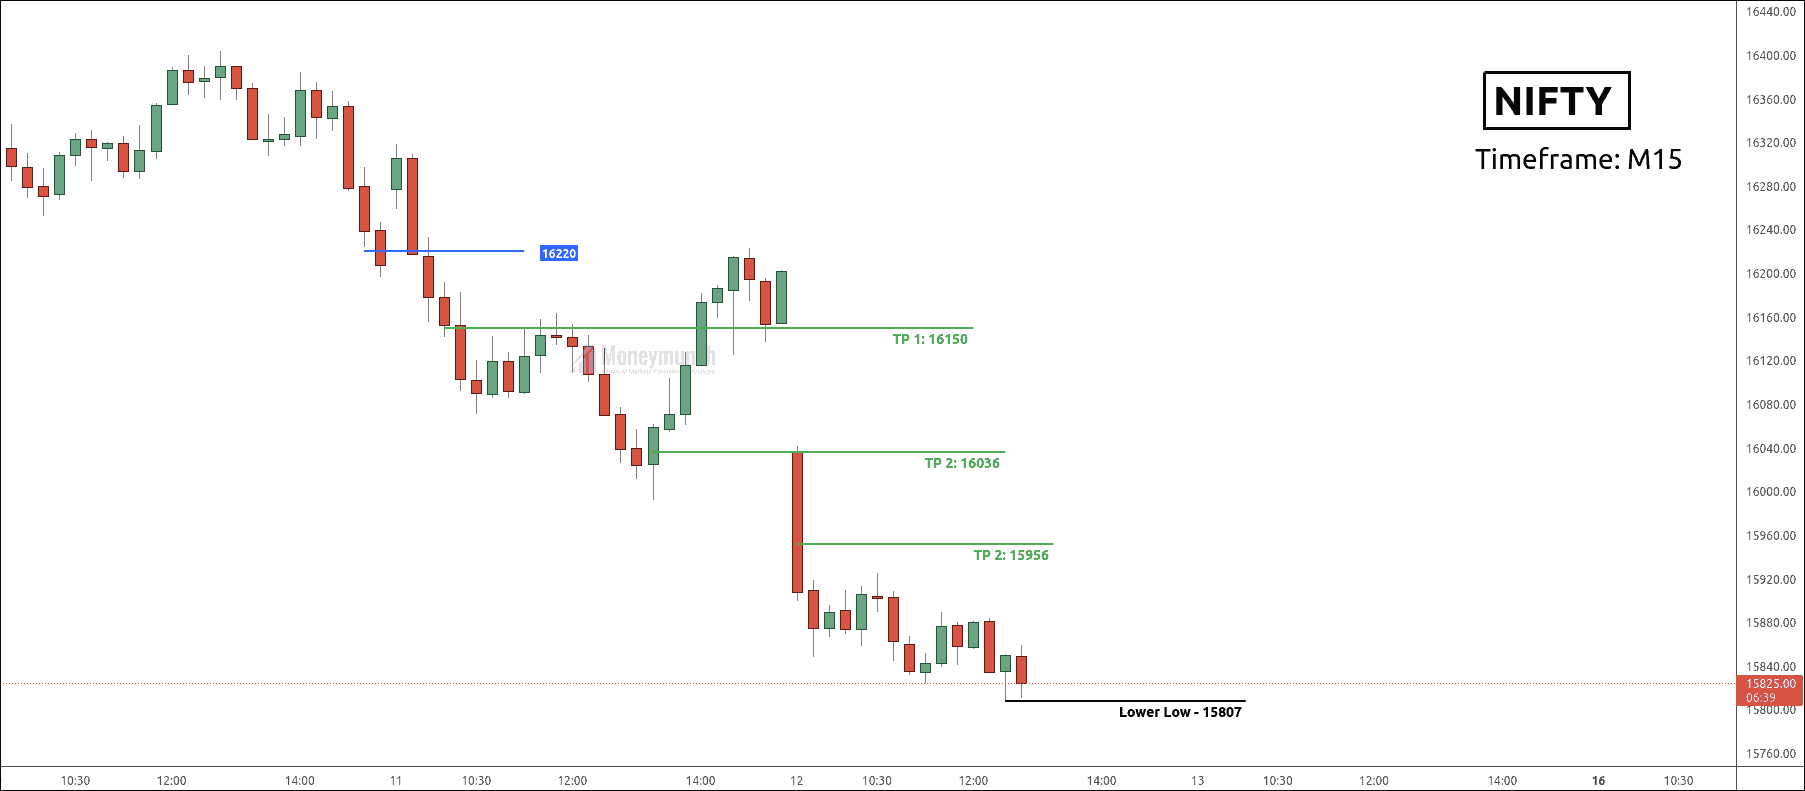
I have mentioned in clear words, “After Gap is down, if the price sustains below 16220, traders can expect the following targets: 16150 – 16036 – 15956.“
Nifty formed a bearish pattern, and It was a gap down signal.
NSE NIFTY & BANKNIFTY Outlook For Intraday Traders
 Yesterday, I published the Bank Nifty 4-hours & weekly timeframe chart. And I had mentioned updating the morning outlook for intraday traders and our subscribers. Here it is:
Is Bank Nifty Resuming Its Bearish Move?
Bank Nifty is occurring in the range between 34700 and, 33370. To get a tradable move, traders should wait for the breakdown of this range.
Traders can short below 34100 for the following targets: 33803 – 33540- 33452. In this phase of declining, traders must wait for a confirmation signal. Buyers can enter above 34700.
Is Nifty Preparing For 15950?
Nifty is forming in the range of 17500 – 16340. Price will face a consolidation if it trades between these levels. We can see big impulsive moves after the price breaks this level.
Today, We will see a gap down in nifty with a speculative boom.
After Gap is down, if the price sustains below 16220, traders can expect the following targets: 16150 – 16036 – 15956.
Bottom always takes time to be formed. A long position is only possible above 16800.
To become a subscriber, subscribe to our free newsletter services. Our service is free for all.
Continue reading
Can BankNifty Retest 32600 Again?
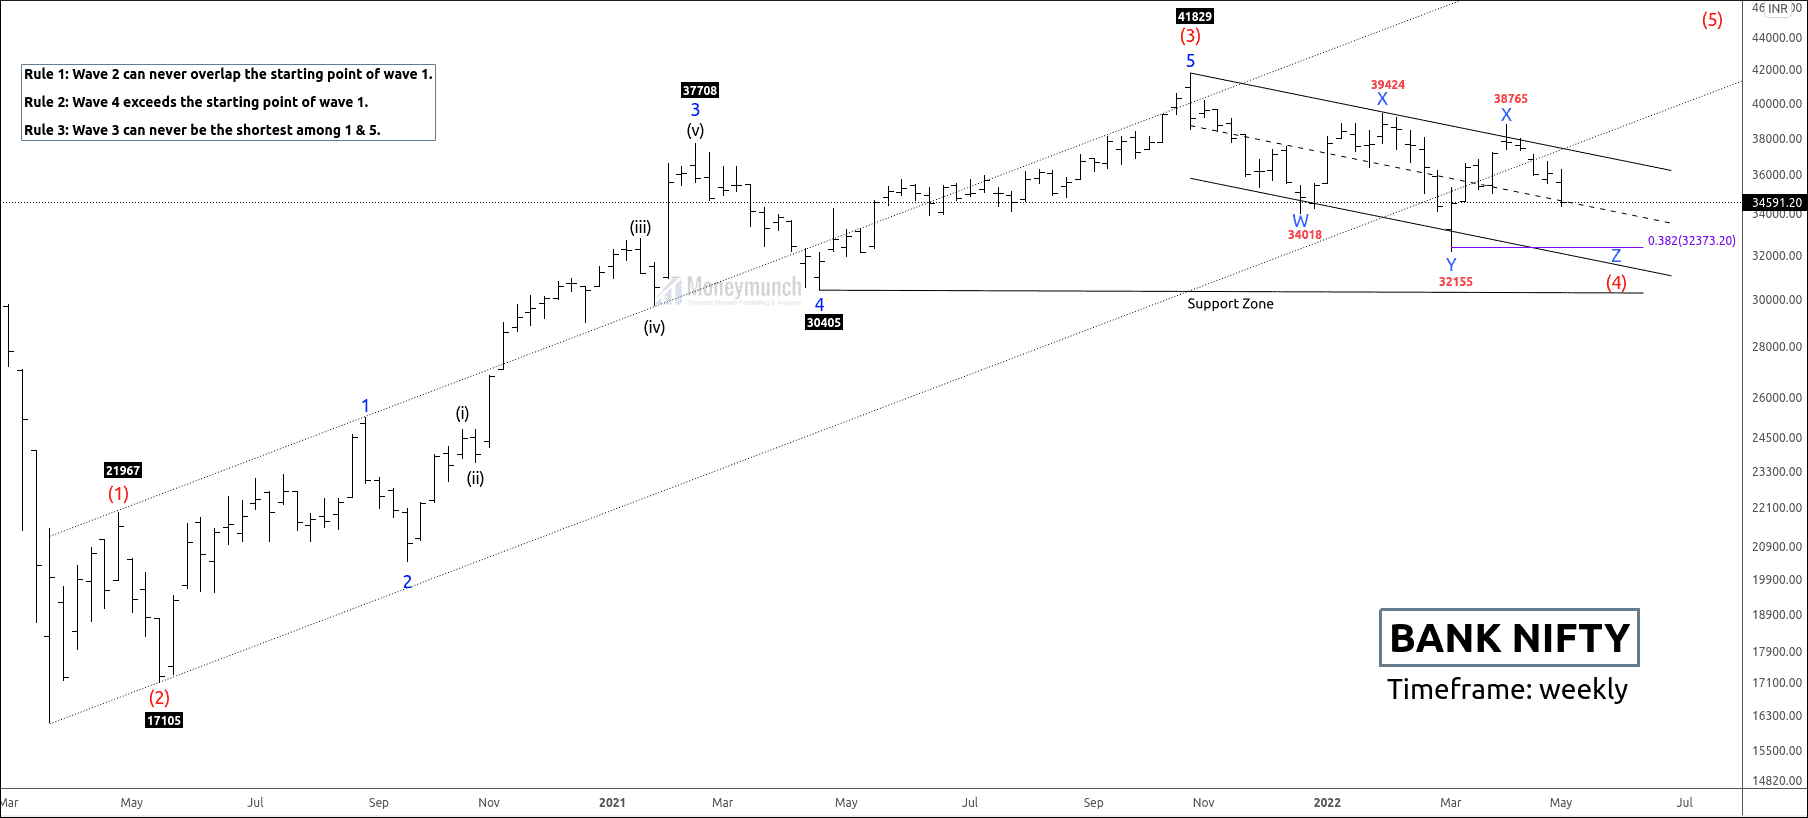
BankNifty Is Unfolding Final Impulsive Wave Z
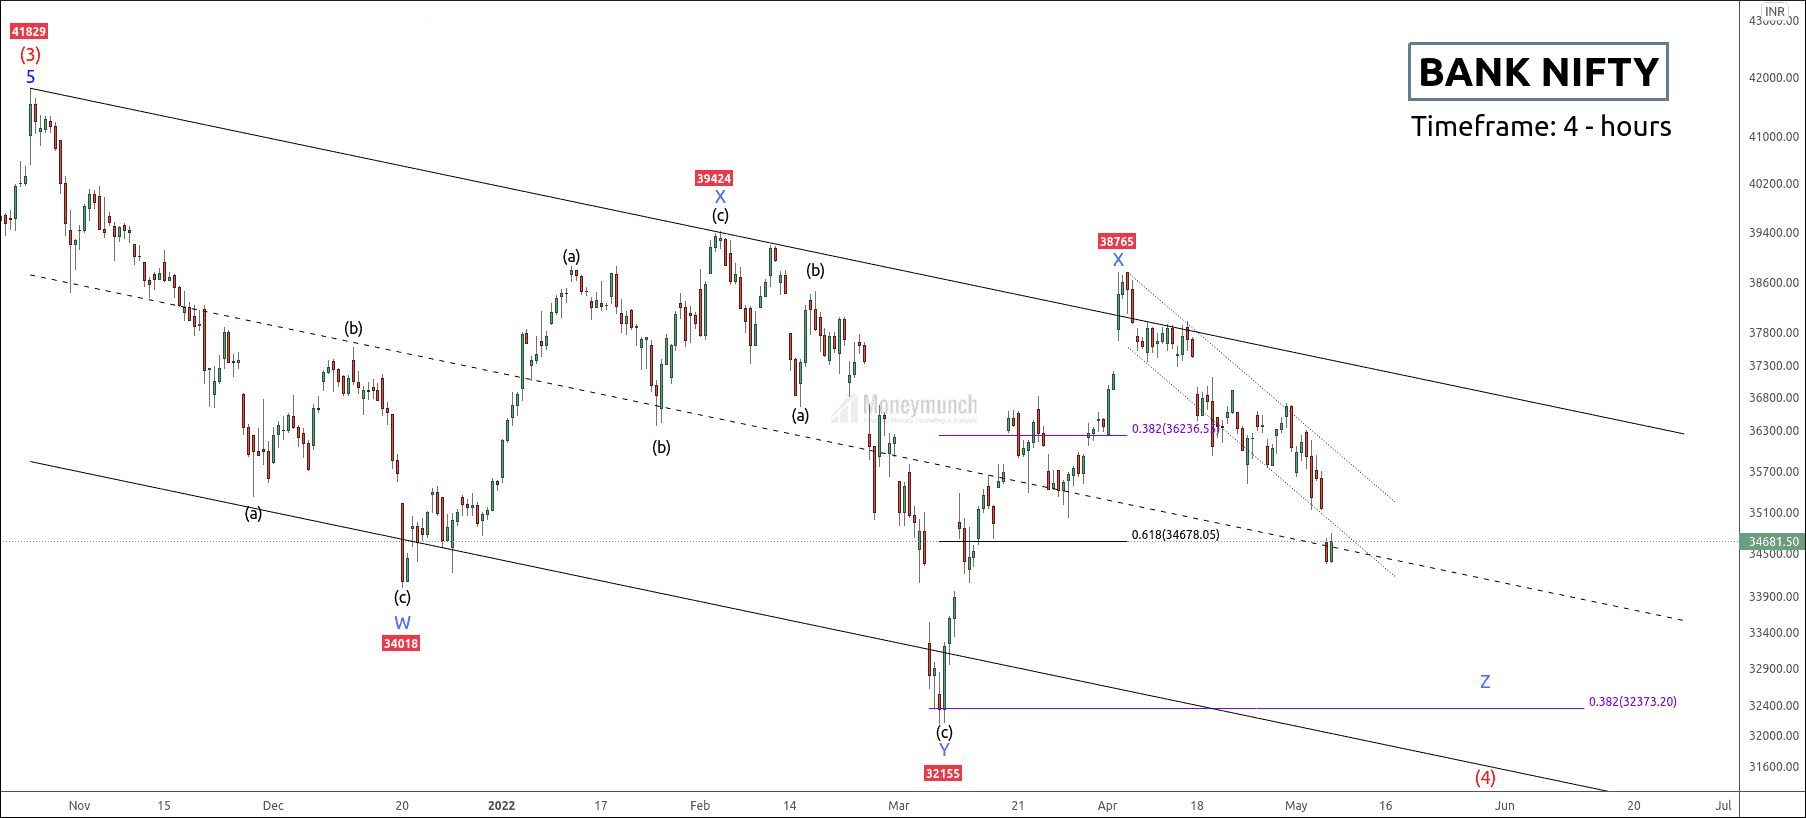
Bank Nifty has started its Elliott wave cycle from the extreme low of 16116. It has completed the extensive impulsive wave (3) at 41829 and started falling in descending channel.
Currently, Banknifty is forming a triple zigzag on the corrective wave (4). Price has occurred the X-2 wave and started wave Z of the triple zigzag.
According to EWT, corrective waves move in the parallel channel, and the impulsive wave breaks the channel. An uptrend can only be possible after the breakout of wave X.
Let’s zoom into the lower timeframe to study this corrective structure:
Price is forming a final leg down Z. If the price breaks the control line, traders can short for the following target levels: 34115 – 33597 – 32613.
But the price has reversed seven times on the control line. If the price sustains above the control line with strong candles, the traders can long the following targets: 35168 – 36689 – 37517.
Although the wave principle has shown a bearish structure, we should always respect the price action.
Day traders should wait for our “morning outlook” for intraday trading on nifty and banknifty futures & options.
To become a subscriber, subscribe to our free newsletter services. Our service is free for all.
Continue reading
NSE Nifty & Bajaj Finserv Stock Tips Update
Have you read the previous research report of Nifty 50?
Click Here – IS NIFTY ABOUT TO RESUME BEARISH THE MOVEMENT?
 BEFORE
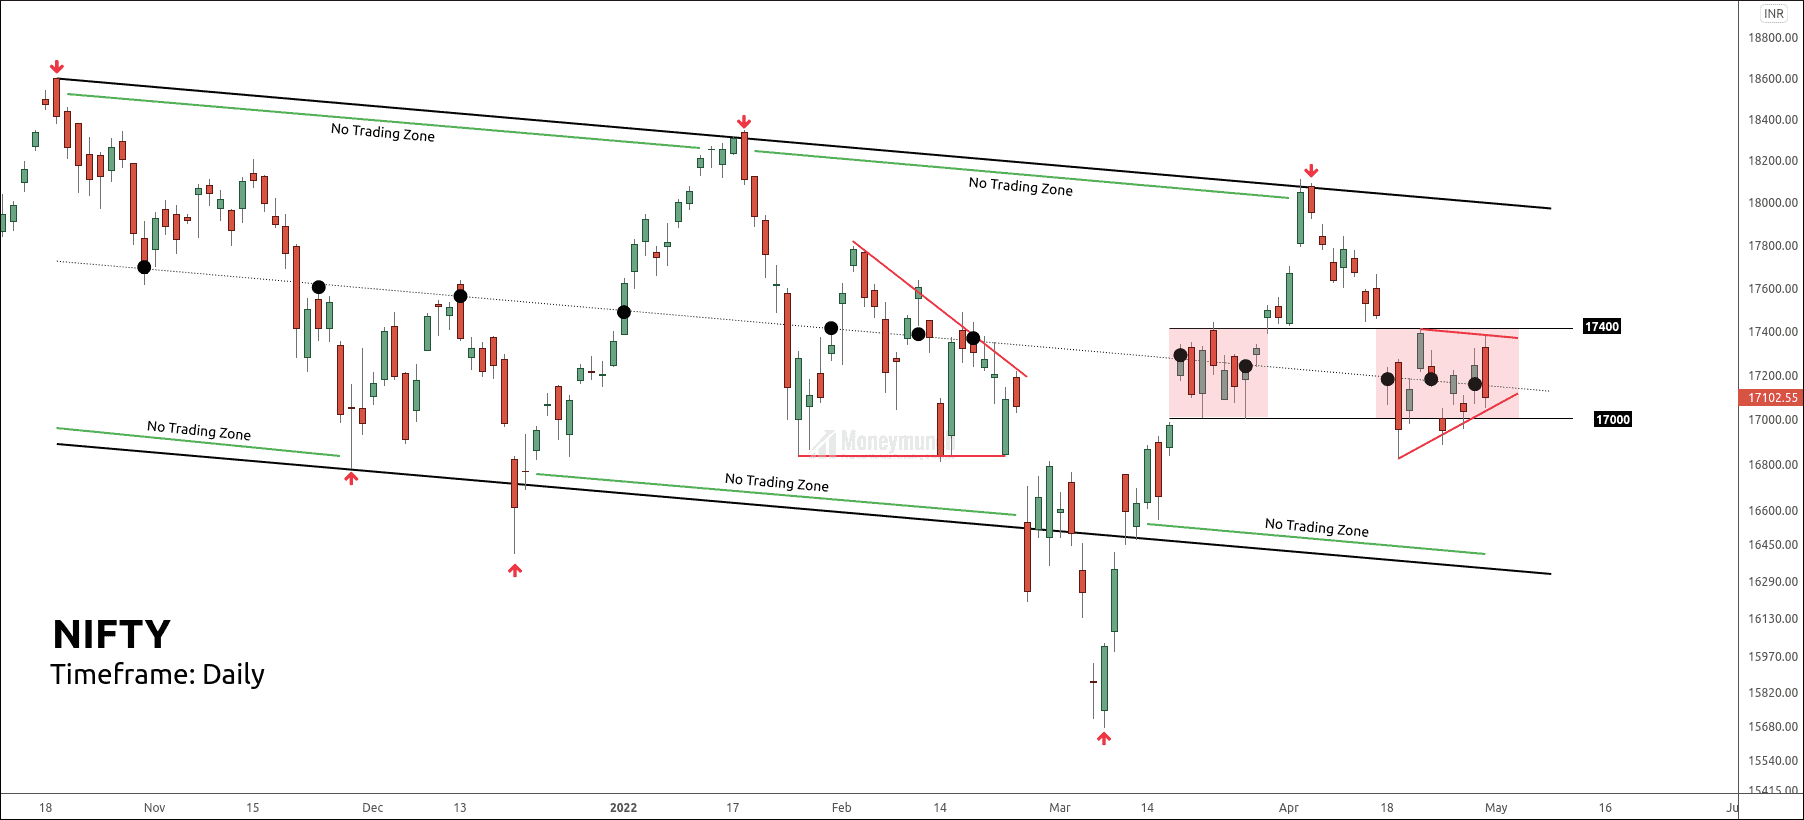
Nifty was in the indecisive movement where the price has formed a triangle on the daily timeframe chart. It was at the control line of the parallel channel.
I had mentioned in bold words, “If the price sustains below 17000, traders can expect good selling up to 16900 – 16821 – 16769.”
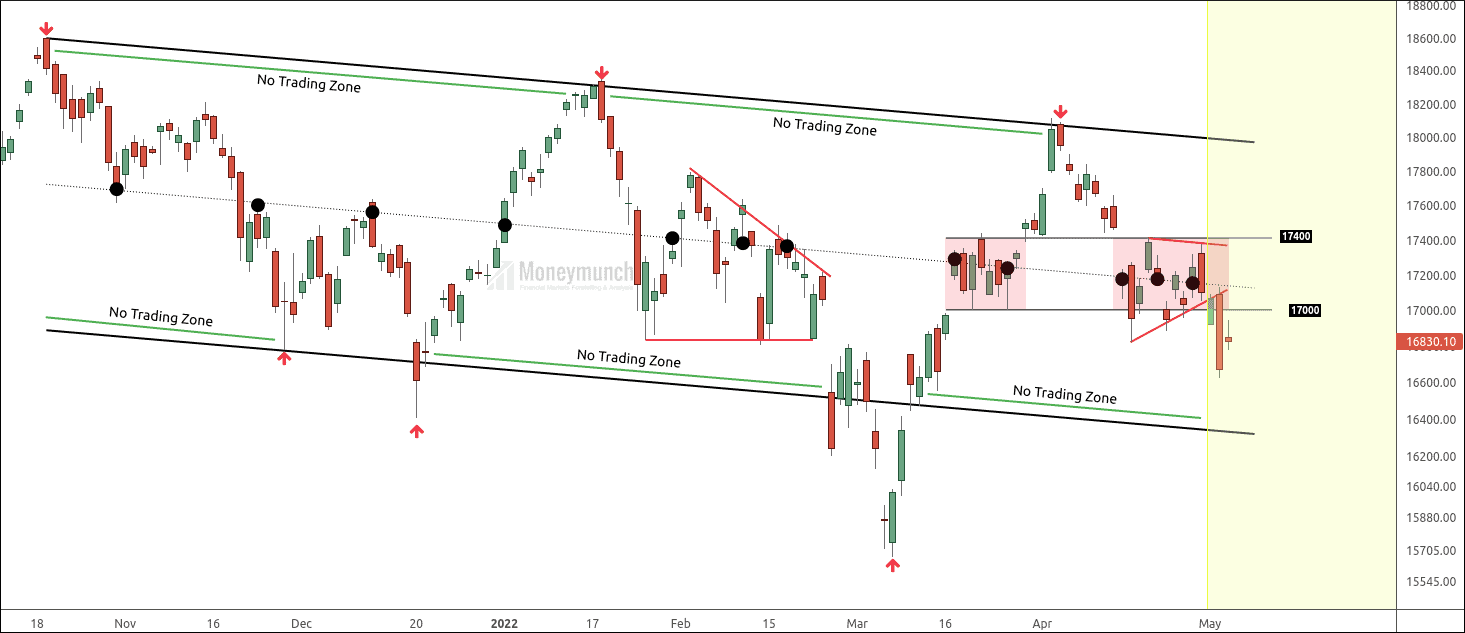 AFTER
AFTER
Nifty had broken down the support level of 17000 and started falling for our targets.
4th May 2022:
- 12:10 AM – Nifty reached the first target of 16900.
- 02:05 PM – Nifty touched the second target of 16821.
- 02:10 PM – Nifty hit the final target of 16769.
If you have bought Nifty 5th MAY 17500 PE @99, you can exit your position at @321.
Nifty 5th MAY 16700 PE @22 has made a high of @127.
If you haven’t traded this call, You have missed 400 points in two trading sessions.
 BEFORE
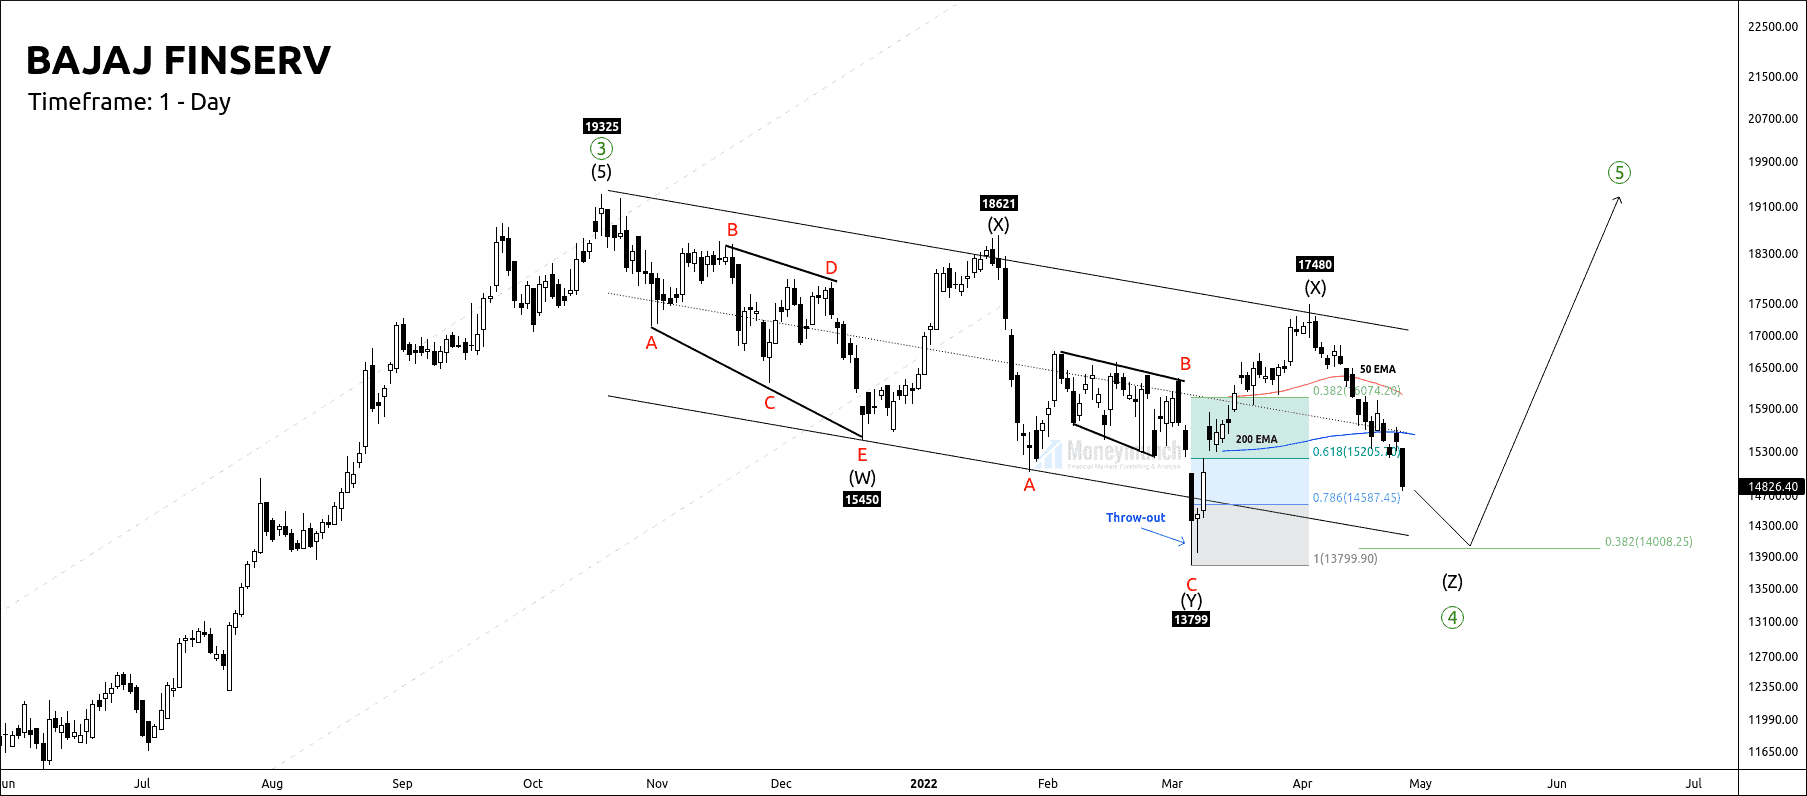
Bajaj Finserv has completed its X wave, and it was ready for the final wave. Wave X is the intermediate wave that connects the two corrective structures (Y) & (Z).
I had written in clear words, “Bajaj Finserv has started it’s final bearish, where we have seen a speculative boom downside. After breaking 50 & 200 EMA, it started falling for wave Z. Traders can expect the following targets: 14631 – 14449 – 14176.”
Do you remember Bajaj Finserv’s wave projection?
Click here – NSE Bajaj Finserv: Elliott Wave Analysis & Tips
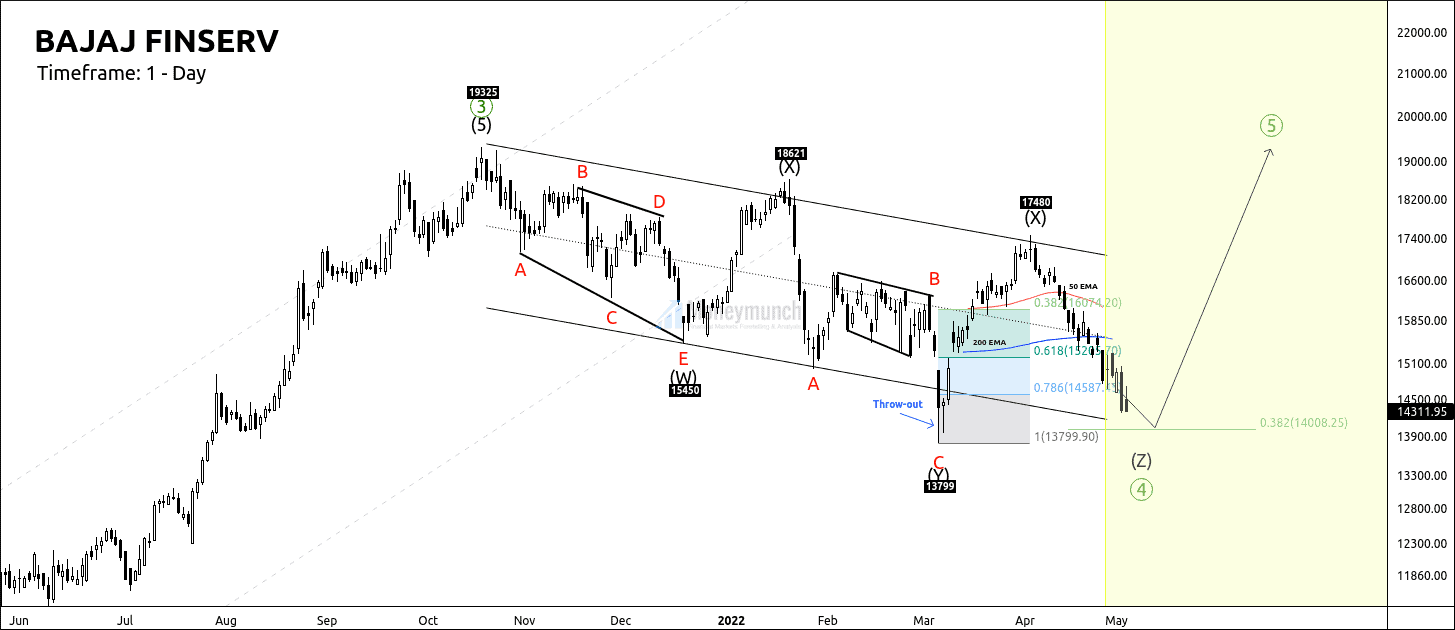 AFTER
AFTER
After the breakout of the control line, the prices started falling.
4 May 2022
- 11:45 AM – Bajaj Finserv hit the first target of 14631.
- 2:05 PM – Bajaj Finserv touched the second target of 14449.
5 May 2022
- 2:10 PM – Bajaj Finserv reached the final target of 14176.
If you have traded this setup, you could get a profit of more than 700 points. To become a subscriber, subscribe to our free newsletter services. Our service is free for all.
Continue reading
Is Nifty About To Resume Bearish The Movement?
Nifty has started its indecisive movement again. Triangle is the best example of a choppy correction, and the break of the structure can give us an excellent opportunity for trading decisions.
Price Action Perspective:
Currently, the price is at the control line of the parallel channel.
Traders are getting trapped in the choppy move of the market. It is hard to take swing decisions due to indecisive movement. If you are waiting for a good swing trade, you can consider the range of 17400 – 17000.
If the price sustains below 17000, traders can expect good selling up to 16900 – 16821 – 16769 below. But safe buying is only possible above 17400, and it can go up to 17600 – 17768 – 17843+.
To become a subscriber, subscribe to our free newsletter services. Our service is free for all.
Continue reading