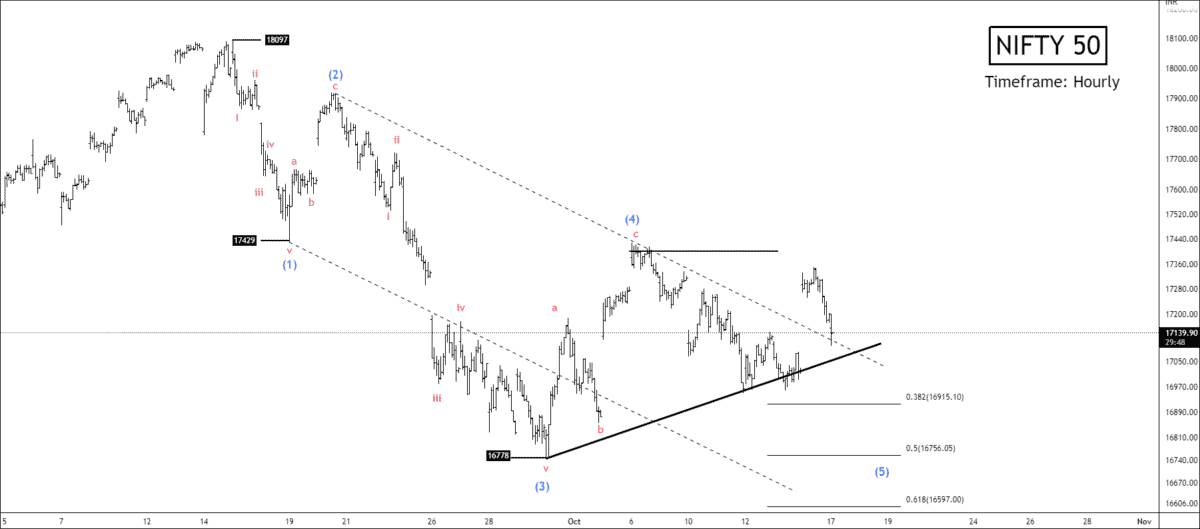
Did you trade the NSE NIFTY Trade setup?
Click here: EWT – NSE NIFTY BULLISH SCENARIO
 BEFORE
Looking for reliable and free nifty trading tips on Nifty Futures or Options, Bank Nifty Futures or Options, and Nifty Indices? Look no further than Moneymunch! We provide intraday and positional trading calls, technical analysis, research reports, and daily or weekly charts to help you make informed trading decisions in the stock market. Subscribe now and stay ahead of the game!
Did you trade the NSE NIFTY Trade setup?
Click here: EWT – NSE NIFTY BULLISH SCENARIO
BEFORE
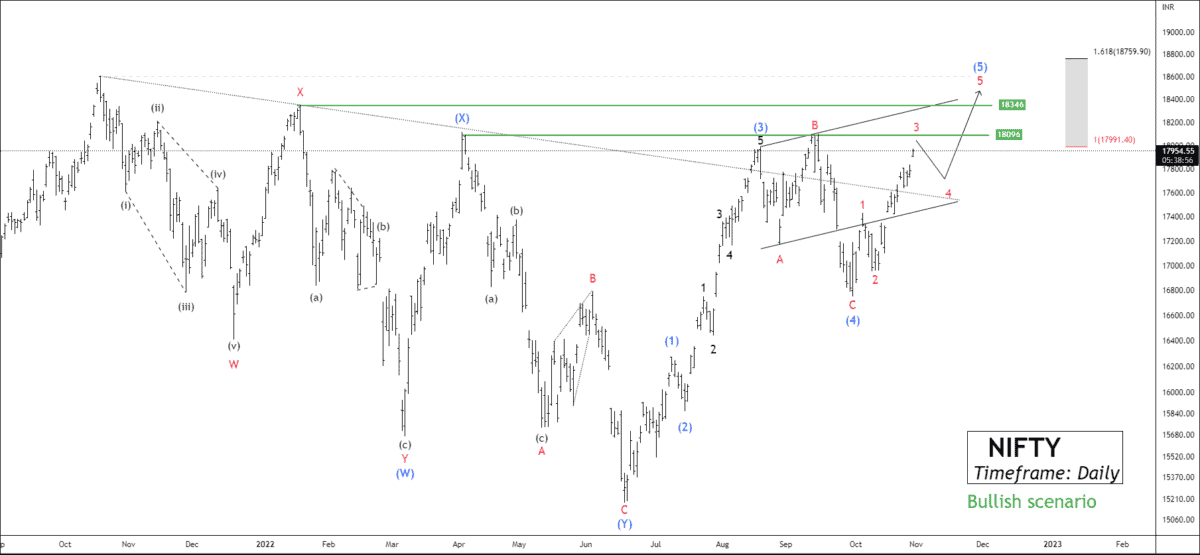
Did you check the previous wave analysis where we predicted a correction to wave 4?
Click here: NIFTY: Wave Projection Suggests A New High But…
Continue reading
 Unlock This Article