NIFTY FUT Trade Setup For Members
 Unlock This Article
Only subscribers can read the full article. Please login to read the entire article.
NSE NIFTY FUT Trade Setup For Subscribers
Only subscribers can read the full article. Please login to read the entire article.
NIFTY & HINDUNILVR – Tips & Update
NIFTY Started Reversing In A Peculiar Way
Do you remember Nifty’s wave analysis?
Click here: NIFTY: Strange Reversal Or Trend Continuation
 Continue reading
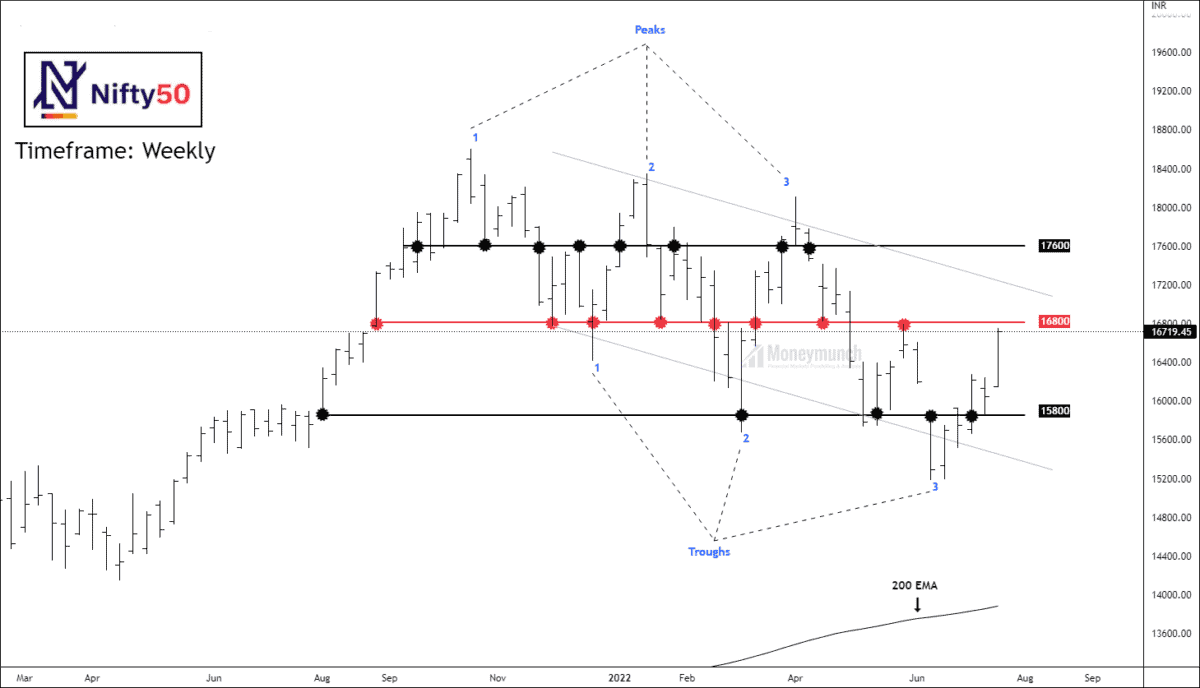
Will Nifty Reach The Final Target Of 15840?
Do you remember Nifty’s wave analysis?
Click here: NIFTY: Strange Reversal Or Trend Continuation
 Continue reading
NIFTY: Strange Reversal Or Trend Continuation
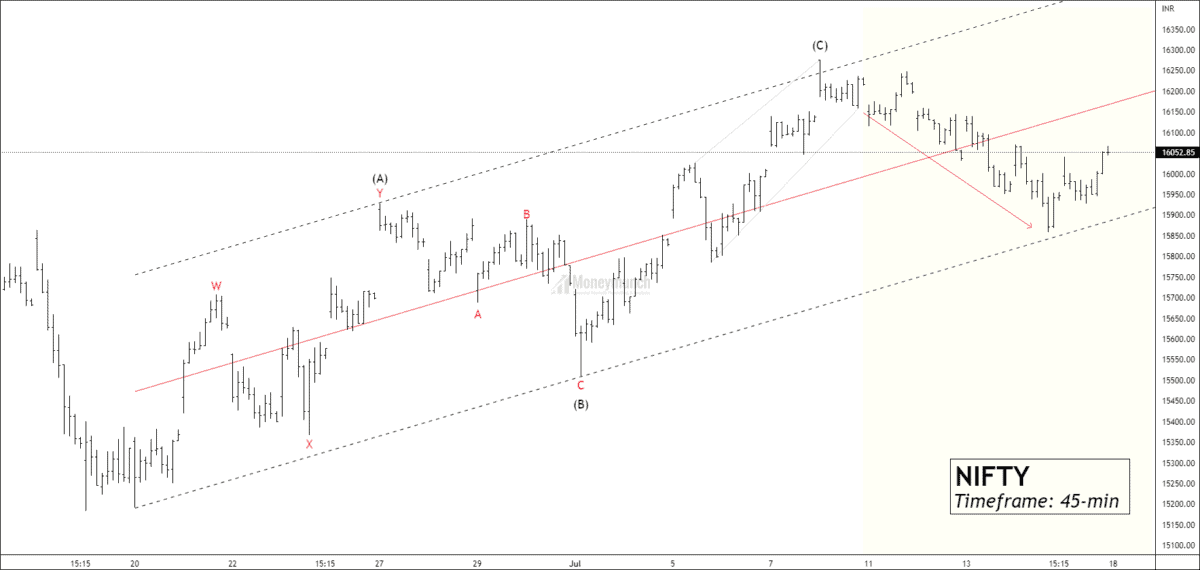
I mentioned in my previous idea that the price has bearish sentiments, but it can go up to 16200, which is a strong resistance level.
Click Here: IS NIFTY PREPARING FOR 14800?
 Continue reading