Enhance your MCX crude oil trading skills with Moneymunch’s free crude oil trading tips and market analysis. Stay updated on the latest commodity market trends and make profitable trades.
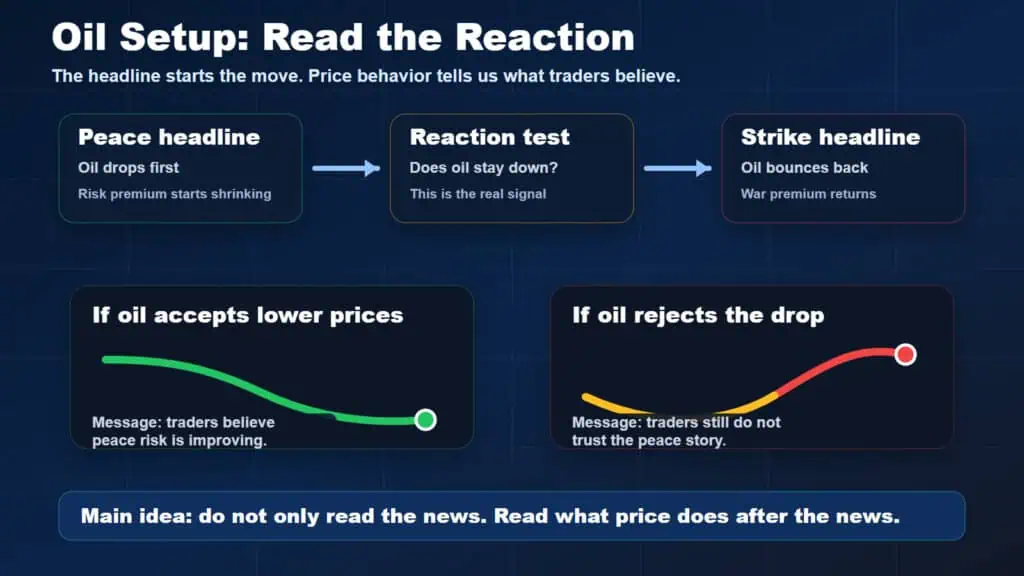
Watch how oil reacts after the news, not just the news itself
Oil is behaving more like a headline market than a normal commodity market right now. Brent crude and WTI crude are moving between two completely different narratives. One side of the market believes peace talks could reduce geopolitical tension and lower supply risk. The other side believes the Middle East situation is still unstable enough to keep a war premium inside oil prices. That is why oil sold off first on peace optimism, then quickly bounced after fresh U.S. strikes in southern Iran reminded traders that geopolitical risk has not disappeared.Continue reading